
File:Hours of Output Deutscher Fernsehfunk.svg

此SVG文件的PNG预览的大小:600 × 480像素。 其他分辨率:300 × 240像素 | 960 × 768像素 | 1,280 × 1,024像素 | 2,560 × 2,048像素。
原始文件 (SVG文件,尺寸为600 × 480像素,文件大小:8 KB)
摘要
| 描述 |
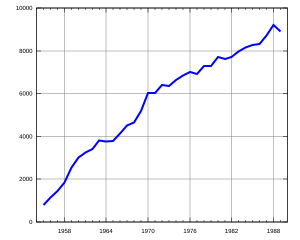
Deutsch: Diagramm zeigt die Anzahl der jährlichen Sendestunden des Deutschen Fernsehfunks.
English: Diagram shows the hours of output of the former east german television Deutscher Fernsehfunk. |
| 日期 | 03.12.2005 |
| 来源 |
Deutsch: Diagramm von mir erstellt mit Gnuplot, für Skripte und Daten s.u.
English: Diagram drawn by myself with Gnuplot, see script and data below |
| 作者 | Dabbelju |
| 授权 (二次使用本文件) |
GFDL |
Source Files
English: To update the diagram, save the dat and plt file in separate text-files and modify the data in the way you want. Then call "gnuplot Hours_of_Output_Deutscher_Fernsehfunk.plt" (under Windows you can start the GUI with wgnuplot and then open the file) and a new SVG file has been created.
Deutsch: Um ein Diagramm zu aktualisieren, speichere die dat- und plt-Datei in Text-Dateien und modifiziere die Daten entsprechend. Dann rufe "gnuplot Hours_of_Output_Deutscher_Fernsehfunk.plt" auf (unter Windows kann auch wgnuplot gestartet und dann diese Datei über die grafische Oberfläche geöffnet werden) und eine neue SVG Datei wurde generiert.
Data File "Hours_of_Output_Deutscher_Fernsehfunk.dat"
# Deutscher Fernsehfunk / Television of GDR
# -----------------------------------------
# Anzahl der Sendestunden pro Jahr von 1955 bis 1989
# Number of hours of output per year from 1955 until 1989
# Quelle/Source: Statistisches Jahrbuch der DDR 1990

1955 786
1956 1138
1957 1448
1958 1855
1959 2539
1960 3007
1961 3259
1962 3420
1963 3807
1964 3767
1965 3774
1966 4142
1967 4514
1968 4642
1969 5193
1970 6028
1971 6038
1972 6402
1973 6360
1974 6634
1975 6851
1976 7020
1977 6905
1978 7290
1979 7283
1980 7704
1981 7610
1982 7716
1983 7962
1984 8163
1985 8265
1986 8320
1987 8706
1988 9194
1989 8900
Gnuplot Script "Hours_of_Output_Deutscher_Fernsehfunk.plt"
set encoding iso_8859_1
set terminal svg
set output 'Hours_of_Output_Deutscher_Fernsehfunk.svg'

set xdata time
set timefmt "%Y"

set xrange ["1954":"1990"]
set yrange [0:10000]

set format x "%Y"
set grid

plot 'Hours_of_Output_Deutscher_Fernsehfunk.dat' using 1:2 notitle with lines lt 3 lw 4
许可协议
我,本作品著作权人,特此采用以下许可协议发表本作品:

|
已授权您依据自由软件基金会发行的无固定段落及封面封底文字(Invariant Sections, Front-Cover Texts, and Back-Cover Texts)的GNU自由文件许可协议1.2版或任意后续版本的条款,复制、传播和/或修改本文件。该协议的副本请见“GNU Free Documentation License”。 |
| 本文件采用知识共享署名-相同方式共享 3.0 未本地化版本许可协议授权。 | ||
| ||
| 本许可协议标签作为GFDL许可协议更新的组成部分被添加至本文件。 |
您可以选择您需要的许可协议。
文件历史
点击某个日期/时间查看对应时刻的文件。
| 日期/时间 | 缩略图 | 大小 | 用户 | 备注 | |
|---|---|---|---|---|---|
| 当前 | 2005年12月4日 (日) 01:56 | | 600 × 480(8 KB) | Dabbelju | == Description == * {{english}} {{Information| |Description = Diagram shows the hours of output of the east german television en:Deutscher Fernsehfunk. |Source = Diagram drawn by myself with Gnuplot, see script and data below |Date = |
文件用途
以下页面使用本文件:
全域文件用途
以下其他wiki使用此文件:
- af.wikipedia.org上的用途
- de.wikipedia.org上的用途
- en.wikipedia.org上的用途
- fr.wikipedia.org上的用途
- it.wikipedia.org上的用途
- vi.wikipedia.org上的用途