
File:Projected impact of climate change on agricultural yields by the 2080s, compared to 2003 levels (Cline, 2007).png
本预览的尺寸:800 × 536像素。 其他分辨率:320 × 215像素 | 640 × 429像素 | 1,024 × 686像素 | 1,280 × 858像素 | 2,008 × 1,346像素。
原始文件 (2,008 × 1,346像素,文件大小:68 KB,MIME类型:image/png)
.png?uselang=zh)
.png?uselang=zh)
.png?action=history&uselang=zh)
.png)
摘要
| 描述 |
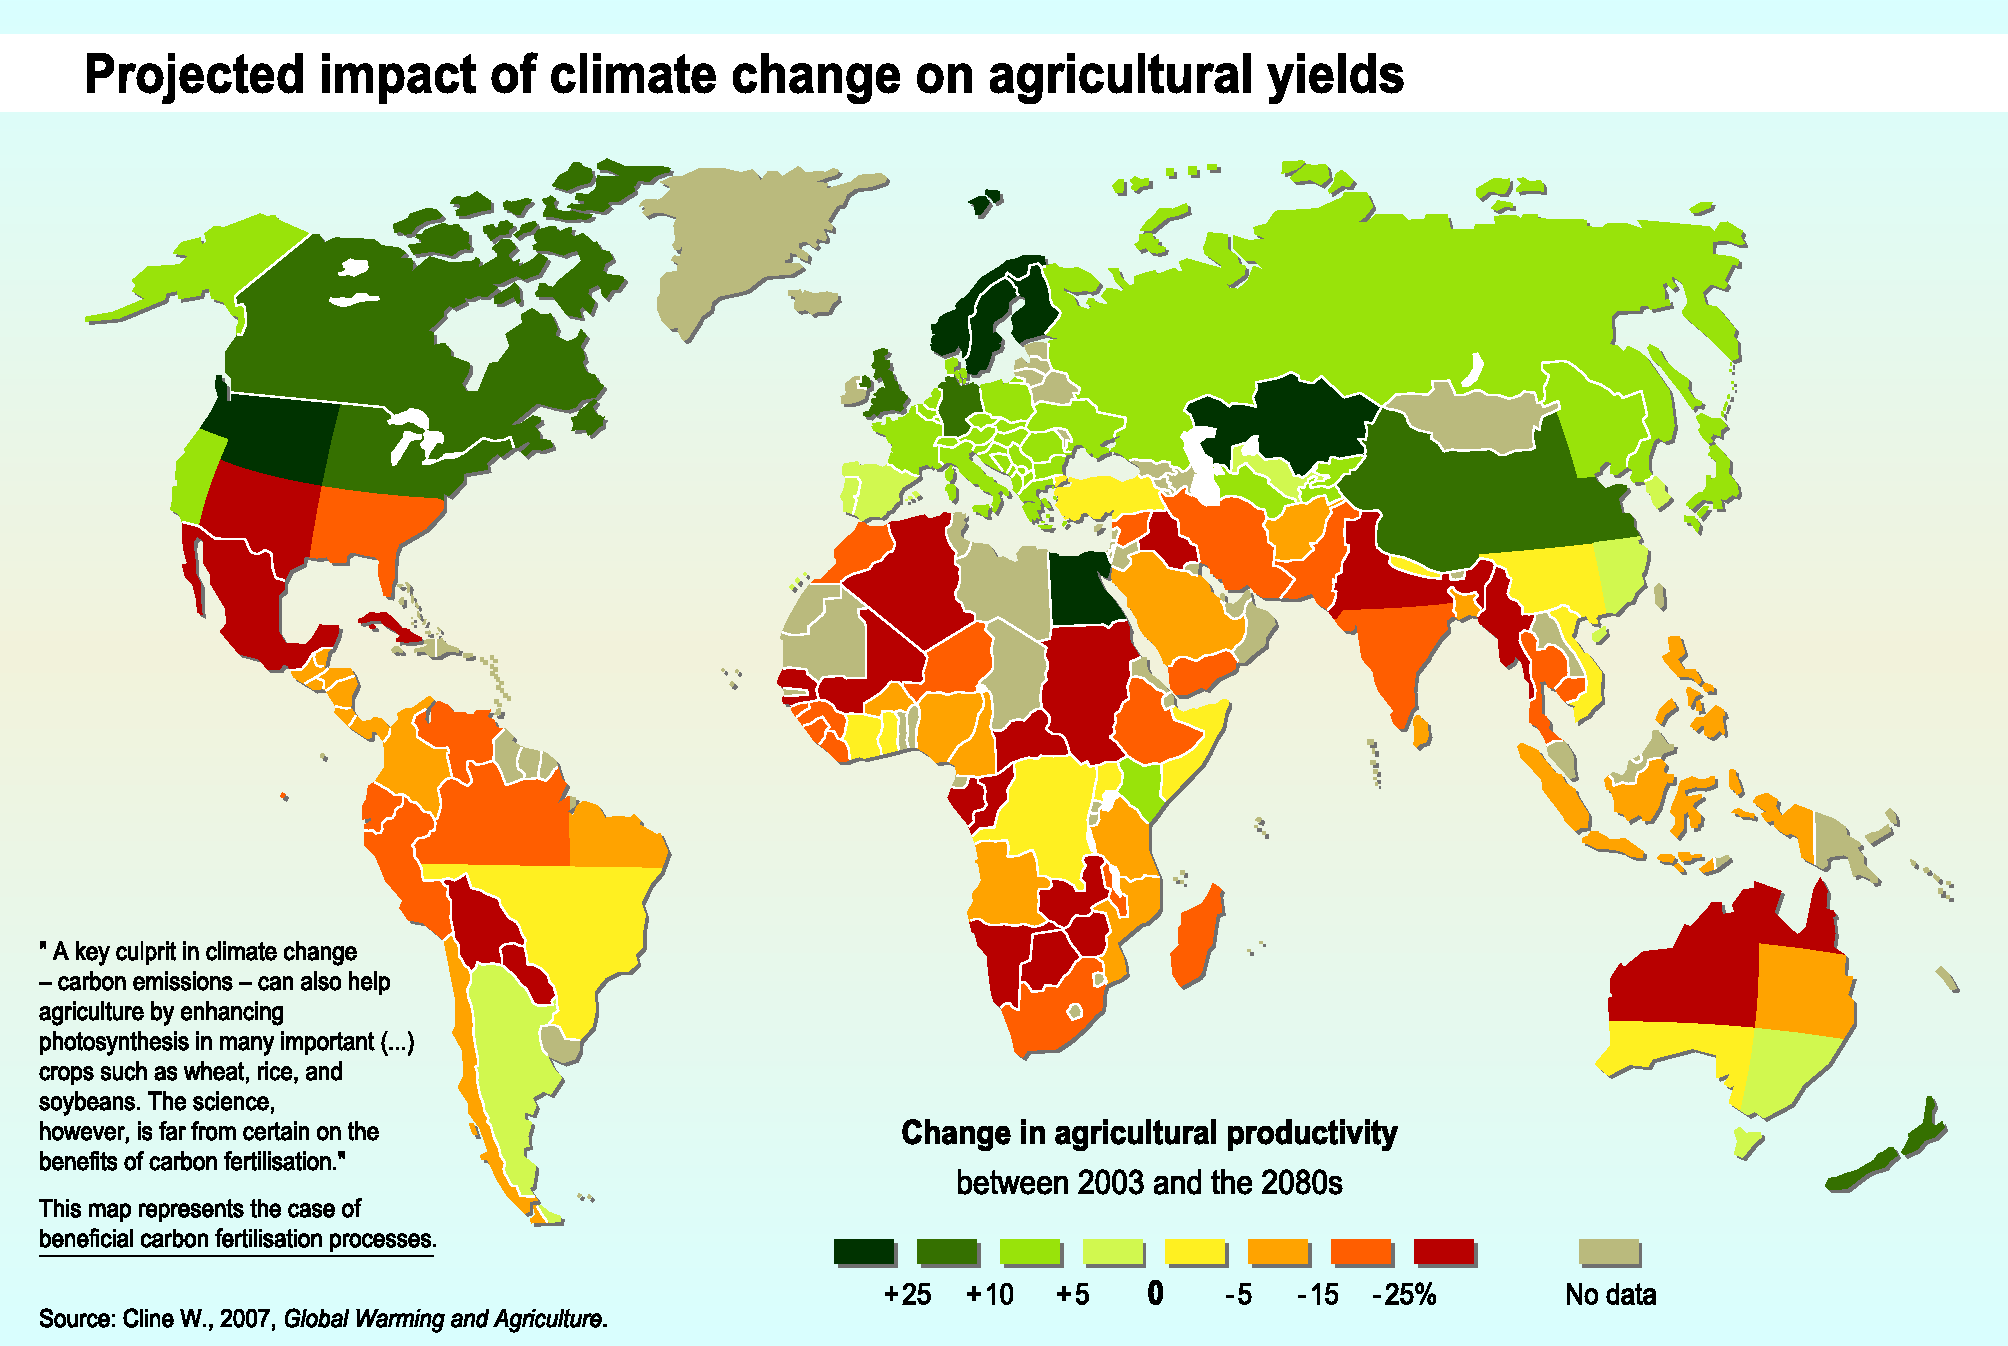
English: This map shows the projected impact of climate change in the 2080s on agricultural productivity across the world. Impacts are measured as a percentage change in agricultural productivity compared to 2003 levels. It is based on work by Cline (2007) (referred to by the European Environment Agency (EEA), 2011, pp.74-75). Cline (2008) also provides details of the study and can be freely downloaded. According to the EEA (2011, p.74): "Although global production may increase initially (before 2030), global warming is projected to have negative effects in the long run. While production at high latitudes will generally benefit from climate change, in many African countries and Latin America it is projected to be severely compromised [...]." The map represents a "business-as-usual" scenario, i.e., the world adopts no new measures to reduce greenhouse gas emissions (EEA, 2011, p.75). It takes into account the assumed benefits of increases in carbon fertilization (EEA, 2011, p.75). Calculations are based on the average output of six general circulation models (GCMs) of the Earth's climate system (EEA, 2011, p.75). Raw data on which the map is based can be downloaded as an Excel spreadsheet from the source website (EEA, 2010). References: Cline, W.R., (2007): Global Warming and Agriculture: Impact Estimates by Country. Center for Global Development, Washington DC ,USA; Cline, W.R., (March 2008): Global Warming and Agriculture. Finance and Development, vol 45, no. 1. International Monetary Fund, Washington DC, USA; EEA, (2011): The European environment — state and outlook 2010: assessment of global megatrends. European Environment Agency, Copenhagen, Denmark. |
| 日期 | |
| 来源 | EEA (14 December 2010): Projected impact of climate change on agricultural yields. European Environment Agency, Copenhagen, Denmark. Last modified September 5, 2011. |
| 作者 | European Environment Agency, Copenhagen, Denmark |
| 授权 (二次使用本文件) |
From original source: "EEA standard re-use policy: unless otherwise indicated, re-use of content on the EEA website for commercial or non-commercial purposes is permitted free of charge, provided that the source is acknowledged (http://www.eea.europa.eu/legal/copyright). Copyright holder: European Environment Agency." |
许可协议
This image is in the public domain because it is extracted from the European Environment Agency Website, whose material is in the public domain unless otherwise stated (see the copyright notice). Online access: www.eea.eu.int
This is valid despite the copyright notice at the bottom of each page, see this confirmation e-mail. | |

|
此map图片可使用矢量图形重新创建为SVG文件。这具有很多好处;更多信息请参见共享资源:待清理媒体。如果存在此图片的SVG格式,请将其上传,然后将此模板替换为
{{vector version available|新图片名称}}。
建议您将SVG命名为“Projected impact of climate change on agricultural yields by the 2080s, compared to 2003 levels (Cline, 2007).svg”,这样在使用Vector version available(或Vva)模板时就不需要填写新图片名称参数。 |
文件历史
点击某个日期/时间查看对应时刻的文件。
| 日期/时间 | 缩略图 | 大小 | 用户 | 备注 | |
|---|---|---|---|---|---|
| 当前 | 2016年9月25日 (日) 22:00 | | 2,008 × 1,346(68 KB) | SteinsplitterBot | Bot: Image rotated by 180° |
| 2016年9月9日 (五) 00:00 |  | 2,008 × 1,346(69 KB) | SteinsplitterBot | Bot: Image rotated by 180° | |
| 2012年7月16日 (一) 21:26 |  | 2,008 × 1,346(106 KB) | Enescot | {{Information |Description ={{en|1=This map shows the projected impact of climate change in the 2080s on agricultural productivity across the world. Impacts are measured as a percentage change in agricultural productivity compared to 2003 levels. It... |
文件用途
以下2个页面使用本文件:
全域文件用途
以下其他wiki使用此文件:
- bn.wikipedia.org上的用途
- ca.wikipedia.org上的用途
- cs.wikipedia.org上的用途
- cy.wikipedia.org上的用途
- el.wikipedia.org上的用途
- en.wikipedia.org上的用途
- es.wikipedia.org上的用途
- eu.wikipedia.org上的用途
- fr.wikipedia.org上的用途
- hy.wikipedia.org上的用途
- it.wikipedia.org上的用途
- rw.wikipedia.org上的用途
- www.wikidata.org上的用途
- yo.wikipedia.org上的用途
.png)