
File:1999 Pacific typhoon season summary.png

本预览的尺寸:800 × 600像素。 其他分辨率:320 × 240像素 | 640 × 480像素 | 1,024 × 768像素 | 1,280 × 960像素 | 2,560 × 1,920像素 | 4,000 × 3,000像素。
原始文件 (4,000 × 3,000像素,文件大小:5.48 MB,MIME类型:image/png)
摘要
| 描述 |
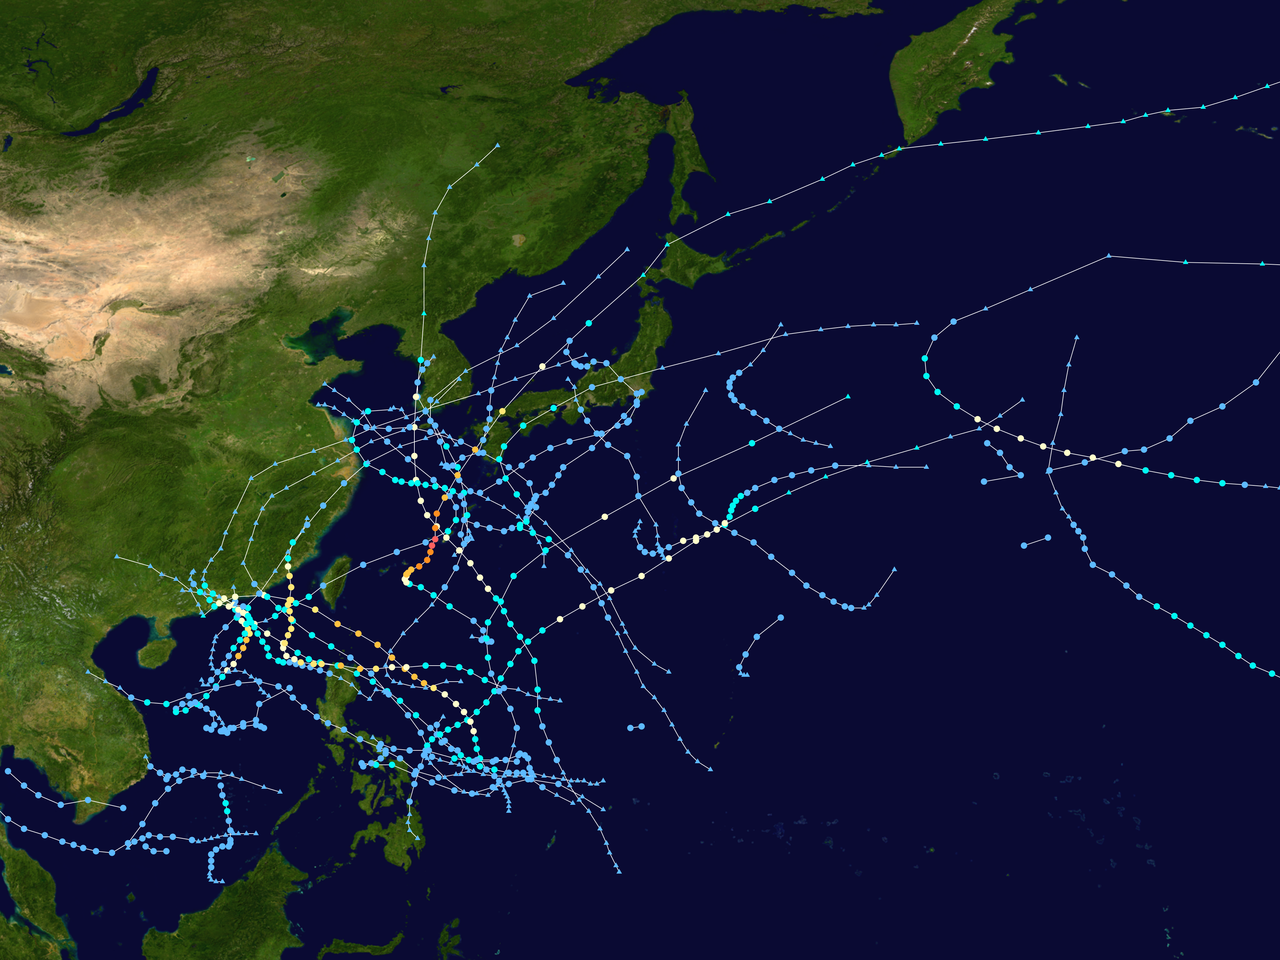
English: This map shows the tracks of all tropical cyclones in the 1999 Pacific typhoon season. The points show the location of each storm at 6-hour intervals. The colour represents the storm's maximum sustained wind speeds as classified in the Saffir-Simpson Hurricane Scale (see below), and the shape of the data points represent the type of the storm. Map generation parameters: --res 4000 --extra 1 --dots 0.2 --lines 0.04 --xmin 100 --xmax 180 --ymin 0 --ymax 60
Tropical depression (≤38 mph, ≤62 km/h)
Tropical storm (39–73 mph, 63–118 km/h)
Category 1 (74–95 mph, 119–153 km/h)
Category 2 (96–110 mph, 154–177 km/h)
Category 3 (111–129 mph, 178–208 km/h)
Category 4 (130–156 mph, 209–251 km/h)
Category 5 (≥157 mph, ≥252 km/h)
Unknown
Storm type |
| 来源 | Created using Wikipedia:WikiProject Tropical cyclones/Tracks. The background image is from NASA [1]. The tracking data is from the Joint Typhoon Warning Center's best track database |
| 作者 | Nino Marakot |
| 本作品已被作者Nino Marakot释出到公有领域。这适用于全世界。 在一些国家这可能不合法;如果是这样的话,那么: Nino Marakot无条件地授予任何人以任何目的使用本作品的权利,除非这些条件是法律规定所必需的。 |
文件历史
点击某个日期/时间查看对应时刻的文件。
| 日期/时间 | 缩略图 | 大小 | 用户 | 备注 | |
|---|---|---|---|---|---|
| 当前 | 2020年2月23日 (日) 05:48 | | 4,000 × 3,000(5.48 MB) | Nino Marakot | Dora corrections |
| 2020年2月9日 (日) 13:16 |  | 4,000 × 3,000(5.48 MB) | Nino Marakot | {{Hurricane season auto track map |start=1999-01-03 |end=1999-12-16 |source=JTWC |type=typhoon |basin=Pacific |year=1999 |comments= Map generation parameters: <tt>--res 4000 --extra 1 --dots 0.2 --lines 0.04 --xmin 100 --xmax 180 --ymin 0 --ymax 60</tt> |author=Nino Marakot }} |
文件用途
以下页面使用本文件:
全域文件用途
以下其他wiki使用此文件:
- en.wikipedia.org上的用途
- ja.wikipedia.org上的用途
- ko.wikipedia.org上的用途
- vi.wikipedia.org上的用途