
File:COVID-19 Prevalence in California by county.svg

此SVG文件的PNG预览的大小:338 × 400像素。 其他分辨率:203 × 240像素 | 406 × 480像素 | 649 × 768像素 | 865 × 1,024像素 | 1,730 × 2,048像素。
原始文件 (SVG文件,尺寸为338 × 400像素,文件大小:74 KB)
摘要
| 描述 |
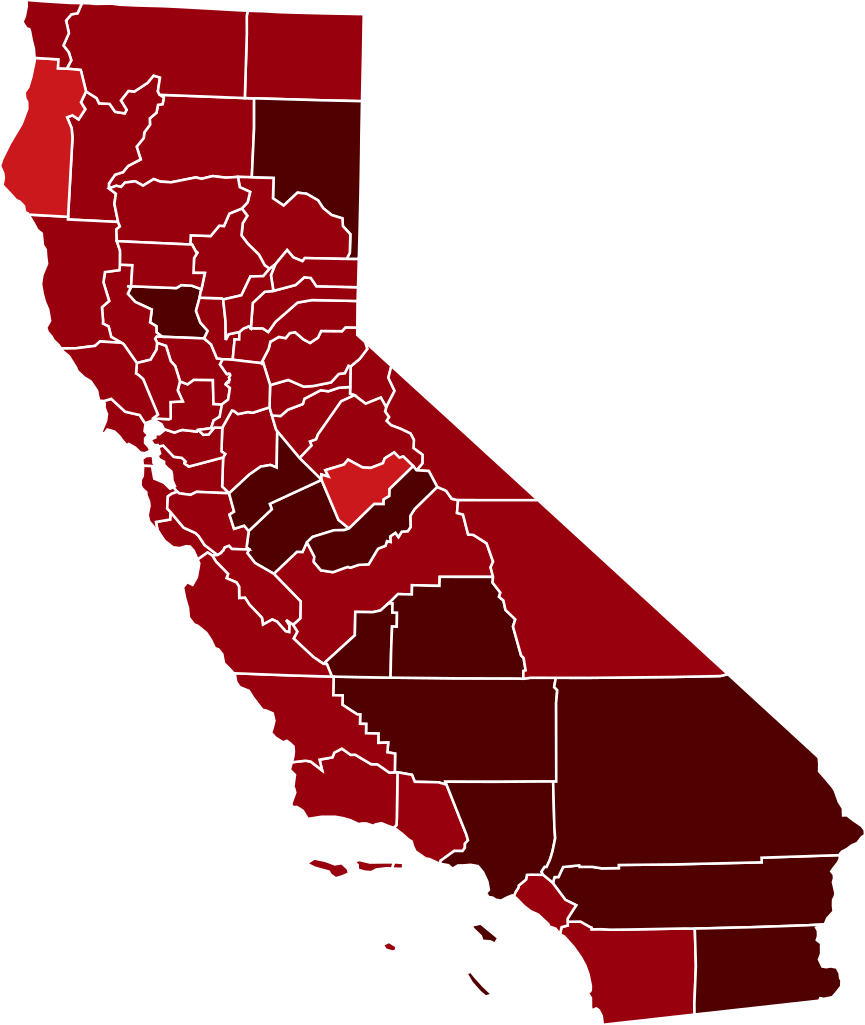
This map shows confirmed cases of w:en:COVID-19, coded by percentage of population confirmed to be infected as of 29 March 2021. The data is used from the data as aggregated and released by Johns Hopkins University and US census (2019 population estimate). As this is a current outbreak, the map might not be up to date. 10.00%+ Confirmed infected
3.00%-10.00% Confirmed infected
1.00%-3.00% Confirmed infected
0.30%-1.00% Confirmed infected
0.10%-0.30% Confirmed infected
0.03%-0.10% Confirmed infected
0.00%-0.03% Confirmed infected
no confirmed cases or no data
The design is based on blank maps available in Public Domain (created by Yiling Chen from TIGER shapefiles), the color scheme is based on color brewer. The script for creating the maps was written by Sukolsak Sakshuwong and Lodewijk Gelauff.
|
||||
| 日期 | |||||
| 来源 | Based on File:Blank_California_Map.svg by user:Thadius856 | ||||
| 作者 | The design is based on blank maps available in Public Domain, the color scheme is based on the design created by platypeanArchcow (PD). The script for creating the maps was written by Sukolsak Sakshuwong and Lodewijk Gelauff. |

许可协议
| 我,本作品著作权人,释出本作品至公有领域。这适用于全世界。 在一些国家这可能不合法;如果是这样的话,那么: 我无条件地授予任何人以任何目的使用本作品的权利,除非这些条件是法律规定所必需的。 |
文件历史
点击某个日期/时间查看对应时刻的文件。
| 日期/时间 | 缩略图 | 大小 | 用户 | 备注 | |
|---|---|---|---|---|---|
| 当前 | 2021年3月14日 (日) 06:17 | | 338 × 400(74 KB) | Eiabot | new data: 13 March 2021 |
| 2021年3月2日 (二) 07:59 |  | 338 × 400(74 KB) | Eiabot | new data: 01 March 2021 | |
| 2021年2月21日 (日) 06:23 |  | 338 × 400(74 KB) | Eiabot | new data: 20 February 2021 | |
| 2021年2月18日 (四) 06:58 |  | 338 × 400(74 KB) | Eiabot | new data: 17 February 2021 | |
| 2021年2月14日 (日) 07:00 |  | 338 × 400(74 KB) | Eiabot | new data: 13 February 2021 | |
| 2021年1月27日 (三) 06:32 |  | 338 × 400(74 KB) | Eiabot | new data: 26 January 2021 | |
| 2021年1月26日 (二) 07:58 |  | 338 × 400(74 KB) | Eiabot | new data: 25 January 2021 | |
| 2021年1月20日 (三) 06:52 |  | 338 × 400(74 KB) | Eiabot | new data: 19 January 2020 | |
| 2021年1月17日 (日) 06:43 |  | 338 × 400(74 KB) | Eiabot | new data: 16 January 2020 | |
| 2021年1月16日 (六) 06:16 |  | 338 × 400(74 KB) | Eiabot | new data: 15 January 2020 |
文件用途
以下页面使用本文件:
全域文件用途
以下其他wiki使用此文件:
- ar.wikipedia.org上的用途
- en.wikipedia.org上的用途
- es.wikipedia.org上的用途
- fa.wikipedia.org上的用途
- id.wikipedia.org上的用途
- it.wikipedia.org上的用途