
File:Energy density.svg

此SVG文件的PNG预览的大小:800 × 500像素。 其他分辨率:320 × 200像素 | 640 × 400像素 | 1,024 × 640像素 | 1,280 × 800像素 | 2,560 × 1,600像素 | 1,080 × 675像素。
原始文件 (SVG文件,尺寸为1,080 × 675像素,文件大小:64 KB)
摘要
| 描述 |
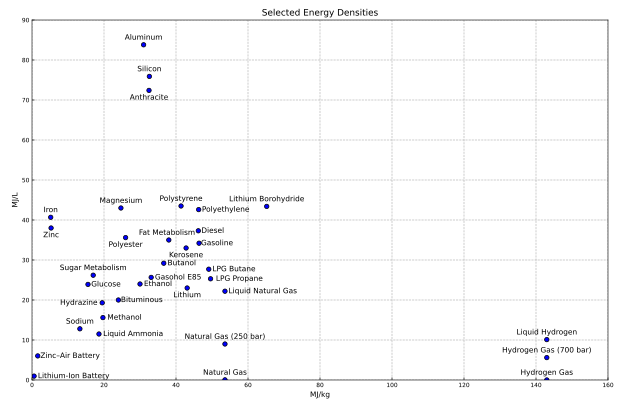
English: A plot of selected energy densities (excluding oxidizers). |
| 日期 | |
| 来源 |
自己的作品 |
| 作者 | Scott Dial |
| 其他版本 |
此文件衍生的作品: Energy density-fr.svg Image:Energy_Density.PNG |
| SVG开发 | 本矢量图使用Matplotlib创作。 |
| 源代码 | Python code#!/usr/bin/env python3
# -*- encoding: utf-8 -*-
import matplotlib
matplotlib.use('agg')
from matplotlib.font_manager import FontProperties
import pylab
import sys
# (name, MJ/kg, MJ/L, [label-adjustments])
data = (
('Aluminum', 31.0, 83.8),
('Anthracite', 32.5, 72.4, {'valign': 'top'}),
('Bituminous', 24, 20, {'valign': 'center', 'x': 6.5}),
('Butanol', 36.6, 29.2, {'valign': 'center', 'x': 5}),
('Diesel', 46.2, 37.3, {'valign': 'center', 'x': 4}),
('Ethanol', 30, 24, {'valign': 'center', 'x': 5}),
('Fat Metabolism', 38, 35, {'x': -0.5}),
('Gasoline', 46.4, 34.2, {'valign': 'center', 'x': 5}),
('Gasohol E85', 33.1, 25.65, {'valign': 'center', 'x': 7.5}),
('Glucose', 15.55, 23.9, {'valign': 'center', 'x': 5}),
('Hydrazine', 19.5, 19.3, {'valign': 'center', 'x': -6.5}),
('Hydrogen Gas', 143, 0.01079),
('Hydrogen Gas (700 bar)', 143, 5.6),
('Iron', 5.2, 40.68), # (burned to Fe2O3)
('Kerosene', 42.8, 33, {'valign': 'top'}),
('Liquid Ammonia', 18.6, 11.5, {'valign': 'center', 'x': 9.5}),
('Liquid Hydrogen', 143, 10.1),
('Liquid Natural Gas', 53.6, 22.2, {'valign': 'center', 'x': 10.5}),
('Lithium', 43.1, 23.0, {'valign': 'top'}),
('Lithium Borohydride', 65.2, 43.4),
('LPG Propane', 49.6, 25.3, {'valign': 'center', 'x': 8}),
('LPG Butane', 49.1, 27.7, {'valign': 'center', 'x': 7}),
('Magnesium', 24.7, 43.0),
('Methanol', 19.7, 15.6, {'valign': 'center', 'x': 6}),
('Natural Gas', 53.6, 0.0364),
('Natural Gas (250 bar)', 53.6, 9),
('Polyester', 26.0, 35.6, {'valign': 'top'}),
('Polyethylene', 46.3, 42.6, {'valign': 'center', 'x': 7.5}),
('Polystyrene', 41.4, 43.5),
('Silicon', 32.6, 75.9),
('Sodium', 13.3, 12.8), # (burned to wet NaOH)
('Sugar Metabolism', 17, 26.2),
('Zinc', 5.3, 38.0, {'valign': 'top'}),
('Zinc–Air Battery', 1.59, 6.02, {'valign': 'center', 'x': 9}),
# 0.54-0.72, 0.9-1.9 (values used are from the Li-Ion battery article)
('Lithium-Ion Battery', 0.576, 0.972, {'valign': 'center', 'x': 11}),
)
font12 = FontProperties(family=['sans-serif'], size=12)
font10 = FontProperties(family=['sans-serif'], size=10)
font8 = FontProperties(family=['sans-serif'], size=8)
pylab.rcParams.update({'figure.figsize': [12, 7.5]})
fig=pylab.figure(1)
ax=pylab.axes([0.05, 0.05, 0.95 - 0.05, 0.95 - 0.05])
ax.set_axisbelow(True)
for v in data:
# (name, MJ/kg, MJ/L, label-adjustments)
label = v[0]
x = v[1]
y = v[2]
if len(v) < 4:
halign = 'center'
valign = 'bottom'
x_text = x
y_text = y + 0.9
else:
halign = v[3].get('halign', 'center')
valign = v[3].get('valign', 'bottom')
x_text = x + v[3].get('x', 0)
y_text = y + v[3].get('y', 0)
if valign == 'bottom':
y_text += 0.9
elif valign == 'top':
y_text -= 0.9
pylab.scatter(x=[x], y=[y], c='b', edgecolors='black')
pylab.text(x=x_text, y=y_text, s=label,
horizontalalignment=halign,
verticalalignment=valign,
fontproperties=font10)
pylab.title('Selected Energy Densities',
fontproperties=font12)
pylab.ylabel('MJ/L', fontproperties=font10)
pylab.xlabel('MJ/kg', fontproperties=font10)
pylab.xticks(fontproperties=font8)
pylab.yticks(fontproperties=font8)
ax.grid(linestyle='dashed')
ax.tick_params(axis="y", direction="in")
ax.tick_params(axis="x", direction="in")
ax.xaxis.grid(True)
ax.yaxis.grid(True)
pylab.xlim(0, 160)
pylab.ylim(0, 90)
pylab.savefig('energy_density.svg', transparent=True)
|
许可协议
| 我,本作品著作权人,释出本作品至公有领域。这适用于全世界。 在一些国家这可能不合法;如果是这样的话,那么: 我无条件地授予任何人以任何目的使用本作品的权利,除非这些条件是法律规定所必需的。 |
文件历史
点击某个日期/时间查看对应时刻的文件。
| 日期/时间 | 缩略图 | 大小 | 用户 | 备注 | |
|---|---|---|---|---|---|
| 当前 | 2023年1月23日 (一) 12:58 | | 1,080 × 675(64 KB) | Scott Dial | Restore background transparency |
| 2023年1月23日 (一) 12:53 |  | 1,080 × 675(63 KB) | Scott Dial | Restored title capitalization | |
| 2023年1月23日 (一) 12:41 |  | 1,080 × 675(63 KB) | Scott Dial | Fix ticks to be inside of the plot area | |
| 2023年1月23日 (一) 12:33 |  | 1,080 × 675(63 KB) | Scott Dial | Restored original chart style | |
| 2021年11月2日 (二) 19:31 |  | 1,080 × 675(75 KB) | Mikhail Ryazanov | rm. capitalitis, upd. for modern Python | |
| 2011年2月9日 (三) 05:51 |  | 1,080 × 675(114 KB) | Scott Dial | Added and updated points in the graph. | |
| 2009年2月9日 (一) 23:46 |  | 1,080 × 675(102 KB) | Scott Dial | Added Li-Ion Battery and removed Teflon | |
| 2008年12月22日 (一) 19:30 |  | 1,080 × 675(104 KB) | Scott Dial | {{Information |Description={{en|1=A plot of selected energy densities (excluding oxidizers).}} |Source=Own work by uploader |Author=Scott Dial |Date=December 22, 2008 |Permission= |other_versions=Image:Energy_Density.PNG }} Data S |
文件用途
全域文件用途
以下其他wiki使用此文件:
- da.wikipedia.org上的用途
- en.wikipedia.org上的用途
- fi.wikipedia.org上的用途
- fr.wikipedia.org上的用途
- fr.wikiversity.org上的用途
- sl.wikipedia.org上的用途
- tr.wikipedia.org上的用途