
File:Hash table average insertion time.png

原始文件 (954 × 620像素,文件大小:5 KB,MIME类型:image/png)

|
此graph图片可使用矢量图形重新创建为SVG文件。这具有很多好处;更多信息请参见共享资源:待清理媒体。如果存在此图片的SVG格式,请将其上传,然后将此模板替换为
{{vector version available|新图片名称}}。
建议您将SVG命名为“Hash table average insertion time.svg”,这样在使用Vector version available(或Vva)模板时就不需要填写新图片名称参数。 |
摘要
| 描述 |
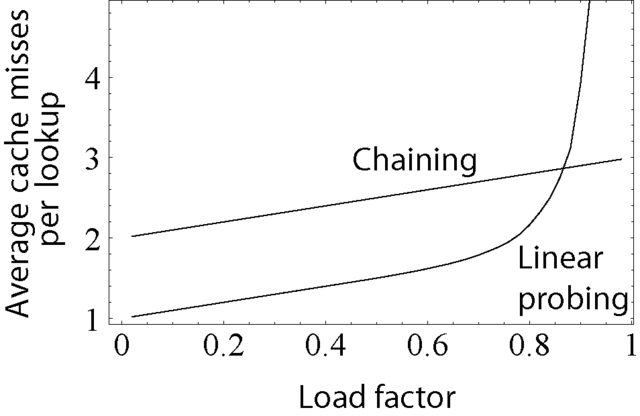
Shows the average number of cache misses expected when inserting into a hash table with various collision resolution mechanisms; on modern machines, this is a good estimate of actual clock time required. This seems to confirm the common heuristic that performance begins to degrade at about 80% table density. Created in Mathematica, Illustrator, and Photoshop. It is based on a simulated model of a hash table where the hash function chooses indexes for each insertion uniformly at random. The parameters of the model were:
For modern CPUs, which have many kilobytes of L1 cache, same logic applies for tables far bigger than size of the cache. You may be curious what happens in the case where no cache exists. In other words, how does the number of probes (number of reads, number of comparisons) rise as the table fills? The curve is similar in shape to the one above, but shifted left: it requires an average of 24 probes for an 80% full table, and you have to go down to a 50% full table for only 3 probes to be required on average. This suggests that in the absence of a cache, ideally your hash table should be about twice as large for probing as for chaining. |
||
| 来源 |
Author's Own Work. 本PNG 位图使用Mathematica创作。 |
||
| 作者 | Derrick Coetzee (User:Dcoetzee) | ||
| 授权 (二次使用本文件) |
|
Mathematica Coding
Because the linear probing values varied widely according to the random choices used to fill the table, I took the average value over 25 runs. The (rather inefficient) Mathematica code used to generate the table follows:
<<Statistics`DescriptiveStatistics`;

f[tablesize_,points_,cachewords_]:=
  Module[{i,r,j,compares1,compares2,k,slots1,slots2},
    slots1 = Table[0,{i,1,tablesize}];
    slots2 = Table[0,{i,1,tablesize}];
    Table[
      For[i=0,i<Floor[Length[slots1]/(points+1)],i++,
        r=Random[Integer,{1,Length[slots1]}];
        slots1[[r]]++];
      For[i=0,i<Length[slots1]/(points+1),i++,
        r=Random[Integer,{1,Length[slots2]}];
        For[j=r,slots2[[j]]>0,j=If[j\[Equal]Length[slots2],1,j+1]];
        slots2[[j]]++];
      compares2=0;
      For[i=1,i<=Length[slots2],i++,
        For[j=i,slots2[[j]]>0,j=If[j\[Equal]Length[slots2],1,j+1]];
        compares2+=
          Ceiling[If[j\[GreaterEqual]i,j-i,j+Length[slots2]-i]/cachewords]];
      {N[Apply[Plus,slots1]/Length[slots1]]+2,
        N[compares2/Length[slots2]]+1},{k,1,points}]];

t=Table[f[1000,49,16],{i,1,25}];
Export["Hash_table_average_insertion_time.eps",
  Show[Map[ListPlot[#,PlotJoined\[Rule]True,Frame\[Rule]True,
          FormatType\[Rule]TraditionalForm,
          FrameLabel\[Rule]{"Density of table",
              "Average cache misses per insertion"},Axes\[Rule]False]&,
      Table[{i/50,Mean[Table[t[[k,i,j]],{k,1,Length[t]}]]},{j,1,2},{i,1,
          Length[t[[1]]]}]]]]
文件历史
点击某个日期/时间查看对应时刻的文件。
| 日期/时间 | 缩略图 | 大小 | 用户 | 备注 | |
|---|---|---|---|---|---|
| 当前 | 2011年2月25日 (五) 23:52 | | 954 × 620(5 KB) | Perhelion | test PNGOUT plugin |
| 2005年11月9日 (三) 05:16 |  | 954 × 620(12 KB) | Dcoetzee | Upload bigger version, add 1 to chaining line (due to external storage), change labels | |
| 2005年11月8日 (二) 01:49 |  | 250 × 162(6 KB) | Dcoetzee | Shows the average number of cache misses expected when inserting into a hash table with various collision resolution mechanisms; on modern machines, this is a good estimate of actual clock time required. This seems to confirm the common heuristic that per |
文件用途
以下页面使用本文件:
全域文件用途
以下其他wiki使用此文件:
- en.wikipedia.org上的用途
- en.wikibooks.org上的用途
- sk.wikipedia.org上的用途
- uk.wikipedia.org上的用途