跳至內容

File:1990- Annual greenhouse gas emissions - U.S. - line chart.svg

頁面內容不支援其他語言。
這個檔案來自維基共享資源
維基百科,自由的百科全書

原始檔案(SVG 檔案,表面大小:1,200 × 675 像素,檔案大小:5 KB)


摘要

描述
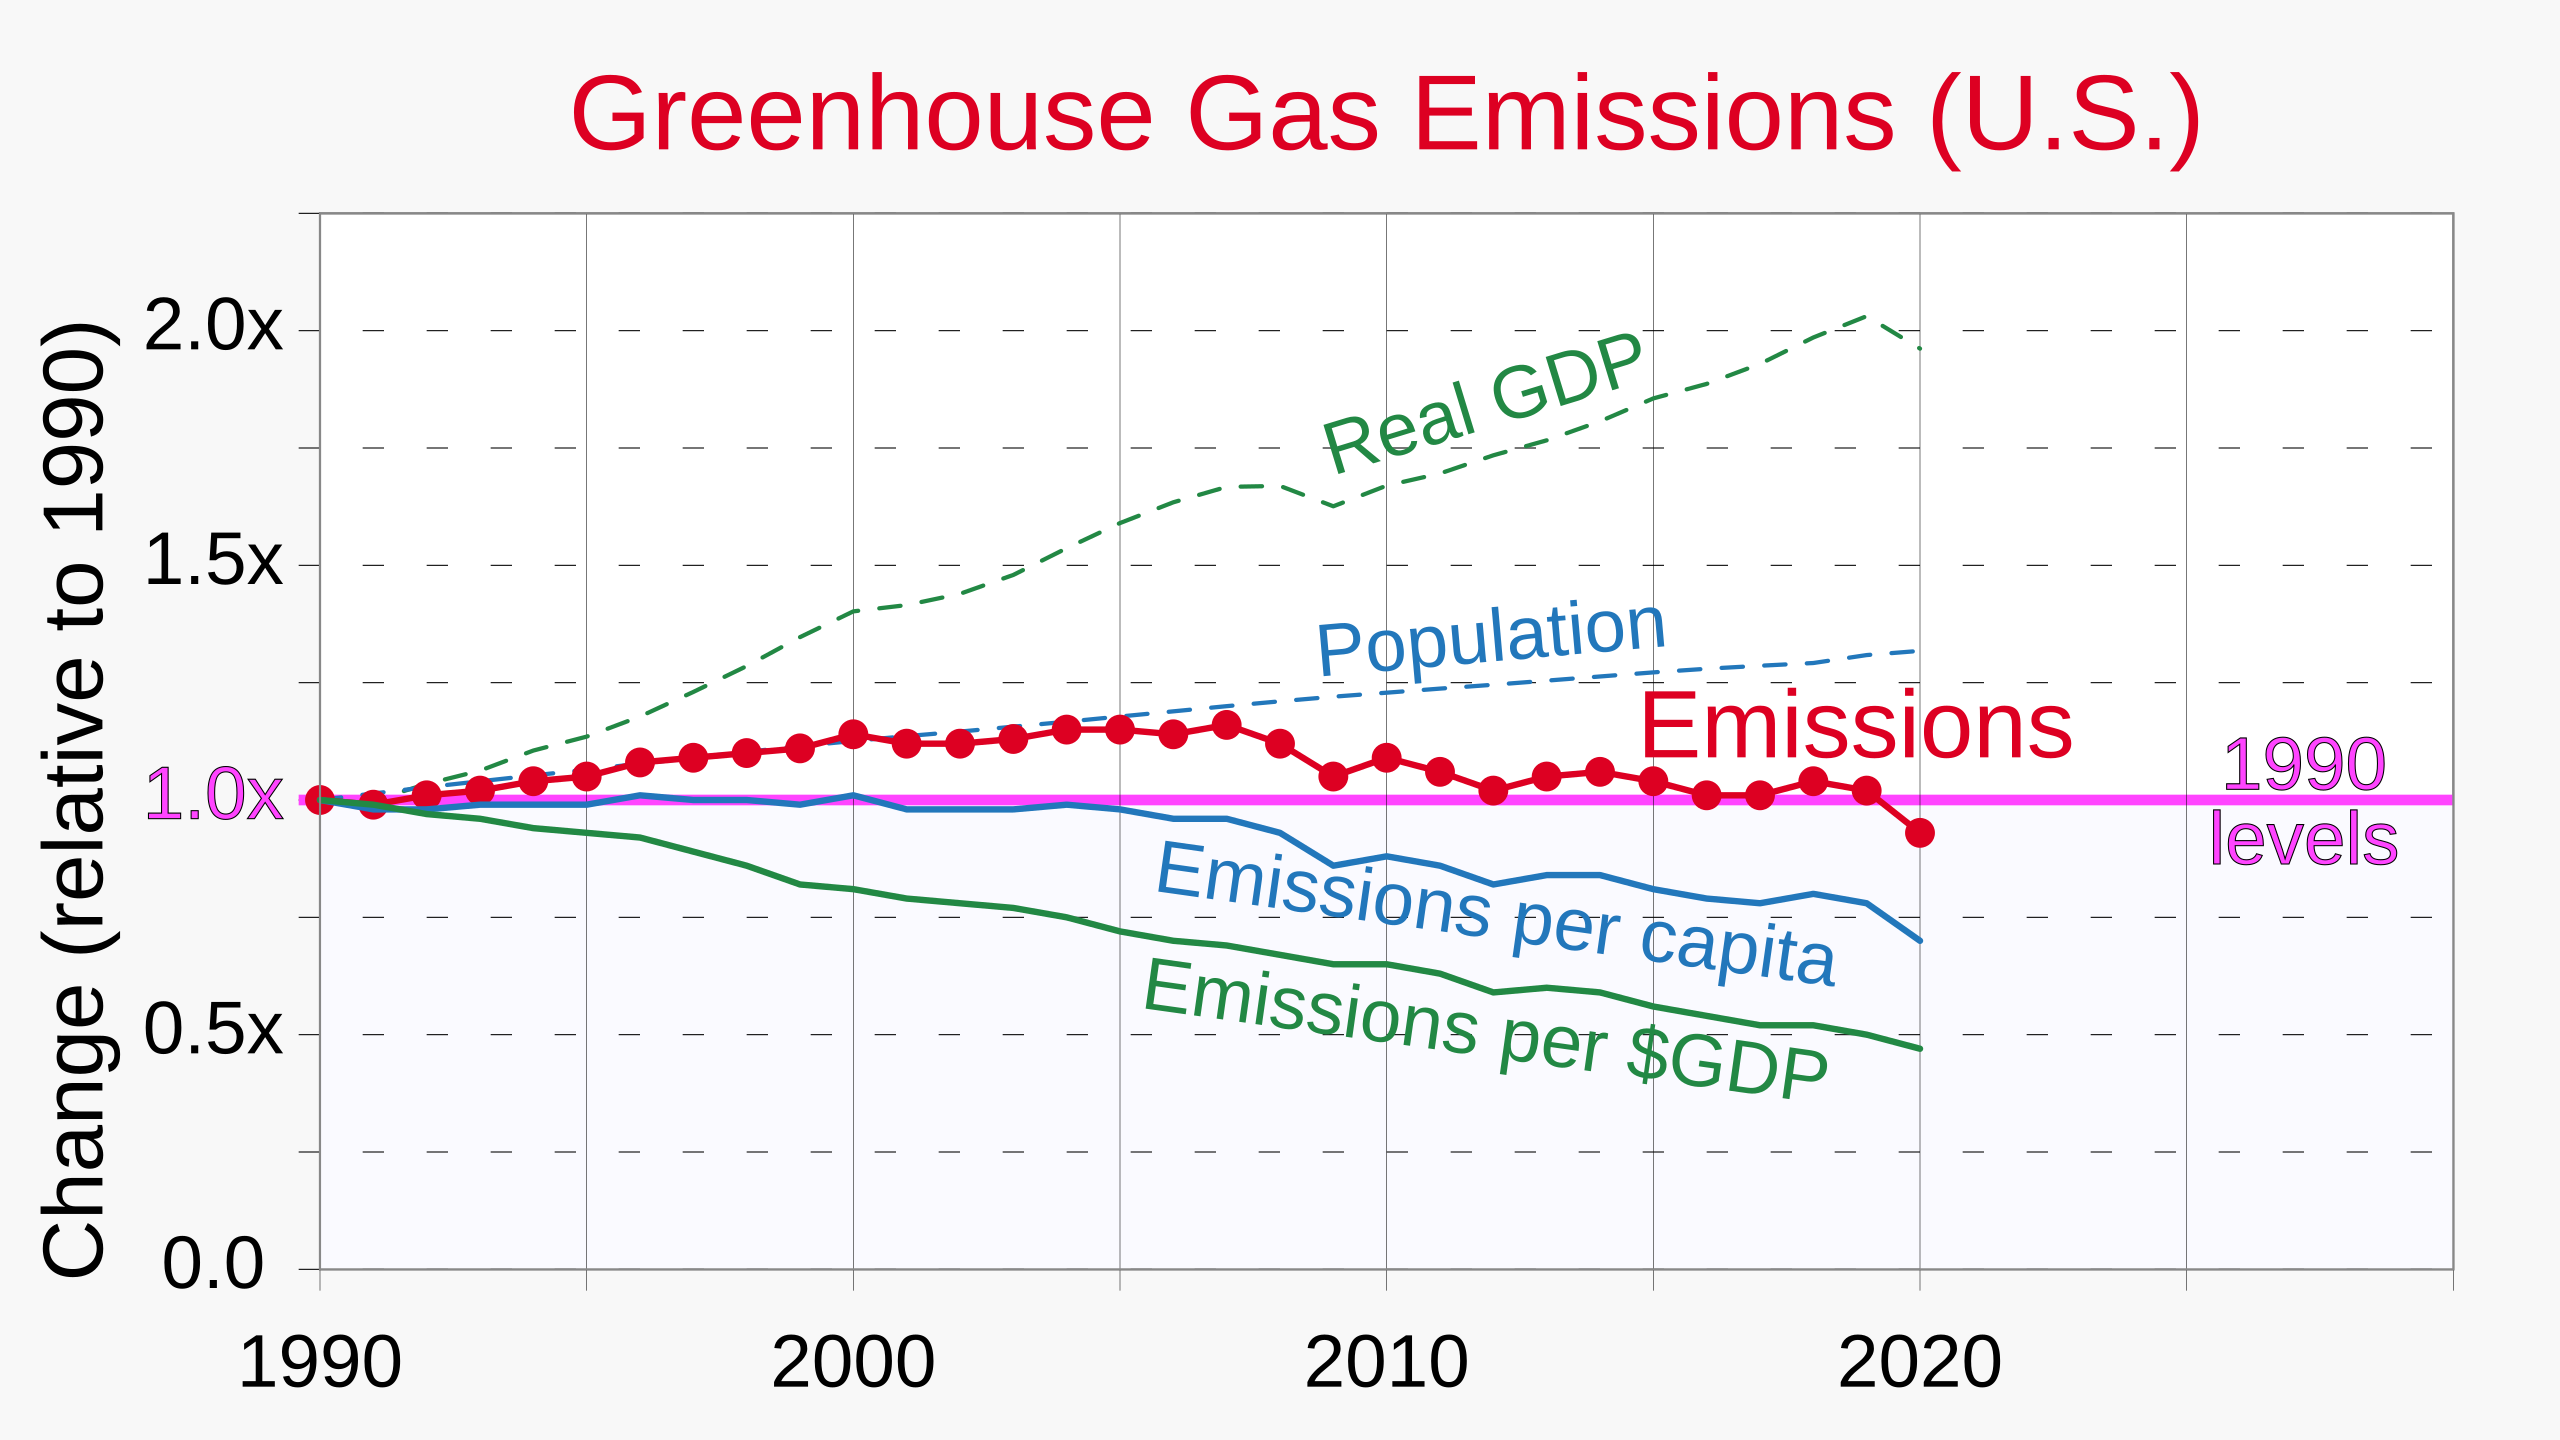
English: Line chart showing annual greenhouse gas emissions of the United States annually since 1990, including total emissions, emissions per capita, and emissions per GDP
  • Source data: Climate Change Indicators: U.S. Greenhouse Gas Emissions / Figure 3. U.S. Greenhouse Gas Emissions per Capita and per Dollar of GDP, 1990–2020. EPA.gov. U.S. Environmental Protection Agency. Archived from the original on 5 April 2023.
  • Archive thereof: https://web.archive.org/web/20230405092424/https://www.epa.gov/climate-indicators/climate-change-indicators-us-greenhouse-gas-emissions
  • Greenhouse gas emissions (data for red trace in Version 1) was derived from other data provided in source.
  • Source explains: "Indicator Notes. While this indicator includes the major greenhouse gases emitted by human activities, it does not include other greenhouse gases and substances that are not covered under the United Nations Framework Convention on Climate Change but that still affect the Earth’s energy balance and climate (see the Climate Forcing indicator for more details). For example, this indicator excludes ozone-depleting substances such as chlorofluorocarbons (CFCs) and hydrochlorofluorocarbons (HCFCs), which have high global warming potentials, as these gases have been or are currently being phased out under an international agreement called the Montreal Protocol. This indicator also excludes black carbon and aerosols, which most greenhouse gas emissions inventories do not cover. While there are many natural greenhouse gas emissions sources, this indicator focuses on emissions that are associated with human activities—those that are most responsible for the observed buildup of these gases in our atmosphere. Although the land use, land-use change, and forestry emission estimates include emissions and sinks from unmanaged lands due to forest growth, fires, and other factors, this indicator does not include other natural sources such as methane emissions from unmanaged wetlands."
  • Source states: "Data Sources. Data for this indicator came from EPA’s Inventory of U.S. Greenhouse Gas Emissions and Sinks: 1990–2020. This report is available online at: www.epa.gov/ghgemissions/inventory-us-greenhouse-gas-emissions-and-sinks. The calculations in Figure 3 are based on GDP and population data provided by the U.S. Bureau of Economic Analysis and the U.S. Census, respectively."
  • SVG code for this graphic was automatically generated by the "Line charts" and "Scatterplots" spreadsheets linked at User:RCraig09/Excel to XML for SVG. Some text and other additions and adjustments were added manually in text editor.
Translate this file This SVG file contains embedded text that can be translated into your language, using any capable SVG editor, text editor or the SVG Translate tool. For more information see: About translating SVG files.
日期
來源 自己的作品
作者 RCraig09

授權條款

我,本作品的著作權持有者,決定用以下授權條款發佈本作品:
w:zh:共享創意
姓名標示 相同方式分享
您可以自由:
  • 分享 – 複製、發佈和傳播本作品
  • 重新修改 – 創作演繹作品
惟需遵照下列條件:
  • 姓名標示 – 您必須指名出正確的製作者,和提供授權條款的連結,以及表示是否有對內容上做出變更。您可以用任何合理的方式來行動,但不得以任何方式表明授權條款是對您許可或是由您所使用。
  • 相同方式分享 – 如果您利用本素材進行再混合、轉換或創作,您必須基於如同原先的相同或兼容的條款,來分布您的貢獻成品。

說明

添加單行說明來描述出檔案所代表的內容
Line chart showing annual greenhouse gas emissions of the United States annually since 1990, including total emissions, emissions per capita, and emissions per GDP

在此檔案描寫的項目

描繪內容

溫室氣體排放 中文 (已轉換拼寫)

沒有維基數據項目的某些值

作者姓名字串 繁體中文 (已轉換拼寫):​RCraig09
維基媒體使用者名稱 繁體中文 (已轉換拼寫):​RCraig09

著作權狀態 繁體中文 (已轉換拼寫)

有著作權 繁體中文 (已轉換拼寫)

檔案來源 Chinese (Taiwan) (已轉換拼寫)

上傳者的原創作品 繁體中文 (已轉換拼寫)

多媒體型式 繁體中文 (已轉換拼寫)

image/svg+xml

校驗和 繁體中文 (已轉換拼寫)

cd9788c84f9e9f06534b6e03b0e5f6a14d44099b

斷定方法:​SHA-1 中文 (已轉換拼寫)

5,495 位元組

675 像素

1,200 像素

檔案歷史

點選日期/時間以檢視該時間的檔案版本。

日期/時間縮⁠圖尺寸用戶備⁠註
目前2023年10月25日 (三) 17:13於 2023年10月25日 (三) 17:13 版本的縮圖1,200 × 675(5 KB)RCraig09Version 2: remove <tspan....> element from vertical axis legend, to work around ongoing SVG text rendering bug on Wikimedia projects
2023年4月6日 (四) 02:42於 2023年4月6日 (四) 02:42 版本的縮圖1,200 × 675(5 KB)RCraig09Uploaded own work with UploadWizard

下列頁面有用到此檔案:

全域檔案使用狀況

以下其他 wiki 使用了這個檔案:

詮釋資料