
File:South Africa 2011 dominant language map.svg

此 SVG 檔案的 PNG 預覽的大小:684 × 599 像素。 其他解析度:274 × 240 像素 | 548 × 480 像素 | 876 × 768 像素 | 1,168 × 1,024 像素 | 2,337 × 2,048 像素 | 809 × 709 像素。
原始檔案 (SVG 檔案,表面大小:809 × 709 像素,檔案大小:798 KB)
摘要
| 描述 |
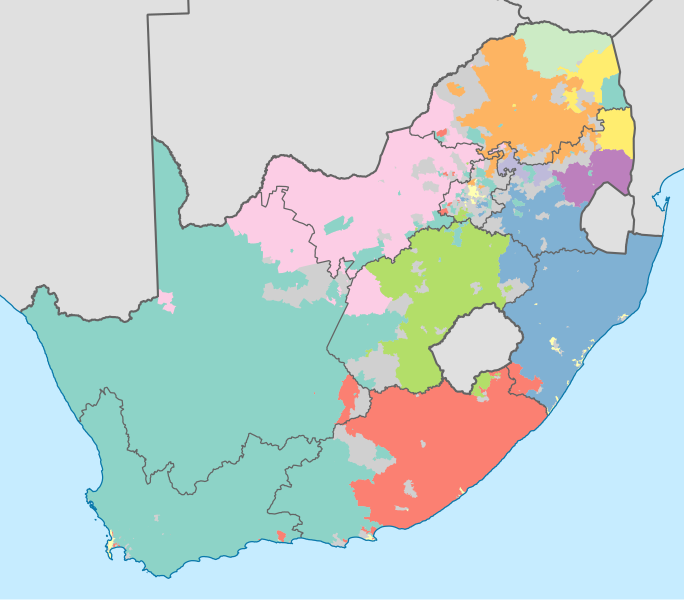
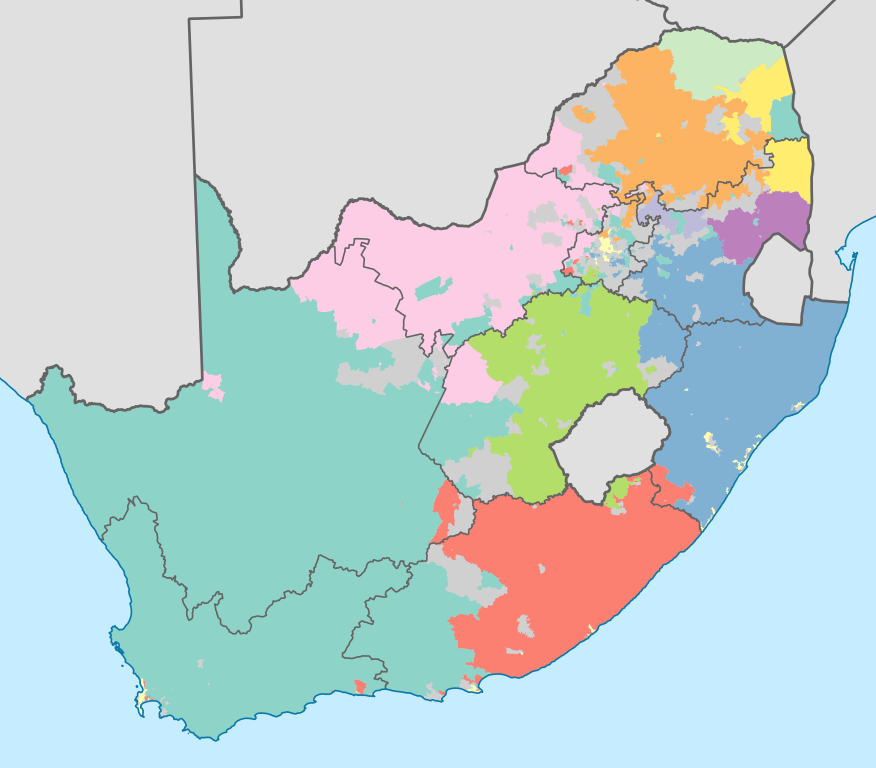
English: Map showing the dominant home languages in South Africa, based on ward-level data from the 2011 census. In this context, a language is dominant if it more than 50% of the population in a ward speak it at home, or more than 33% speak it and no other language is spoken by more than 25%.
English
Afrikaans
isiNdebele
isiXhosa
isiZulu
Sesotho sa Leboa
Sesotho
Setswana
siSwati
Tshivenda
Xitsonga
No language dominant
Projection is Albers Equal-Area Conic, with standard parallels at 25.5° S and 31.5° S, and origin at 28.5° S 24.5° E. |
| 日期 | |
| 來源 | Statistics South Africa's Census 2011 is the source of the basic population data. The map results from my own processing of the data. For ward boundaries see File:South Africa electoral wards 2011 blank.svg. |
| 作者 | Htonl |
| 其他版本 |
South Africa 2011 dominant language map (hex cells).svg: .svg) |
授權條款
The following license applies to the population data on which the map is based:

|
本檔案的著作權持有者,Stats SA,在註明所有人姓名的前提下,允許任何人使用本檔案於任何用途。包含再散布、衍生作品、商業用途及其他用途。 |
姓名標示:
"the user acknowledges Stats SA as the source of the basic data wherever they process, apply, utilise, publish or distribute the data, and also that they specify that the relevant application and analysis (where applicable) result from their own processing of the data" [1]
|
The following tag applies to the map itself:
| 我,此作品的版權所有人,釋出此作品至公共領域。此授權條款在全世界均適用。 這可能在某些國家不合法,如果是的話: 我授予任何人有權利使用此作品於任何用途,除受法律約束外,不受任何限制。 |
檔案歷史
點選日期/時間以檢視該時間的檔案版本。
| 日期/時間 | 縮圖 | 尺寸 | 用戶 | 備註 | |
|---|---|---|---|---|---|
| 目前 | 2012年11月18日 (日) 21:09 | | 809 × 709(798 KB) | Htonl | =={{int:filedesc}}== {{Information |Description={{en|1=Map showing the dominant home languages in South Africa, based on ward-level data from the 2011 census. In this context, a language is dominant if it more than 50% of the population in a ward speak... |
檔案用途
下列4個頁面有用到此檔案:
全域檔案使用狀況
以下其他 wiki 使用了這個檔案:
- af.wikipedia.org 的使用狀況
- cs.wikipedia.org 的使用狀況
- de.wikipedia.org 的使用狀況
- dsb.wikipedia.org 的使用狀況
- en.wikipedia.org 的使用狀況
- eo.wikipedia.org 的使用狀況
- frr.wikipedia.org 的使用狀況
- fr.wikipedia.org 的使用狀況
- fr.wiktionary.org 的使用狀況
- he.wikipedia.org 的使用狀況
- it.wikipedia.org 的使用狀況
- ka.wikipedia.org 的使用狀況
- ko.wikipedia.org 的使用狀況
- lb.wikipedia.org 的使用狀況
- ml.wikipedia.org 的使用狀況
- mzn.wikipedia.org 的使用狀況
- no.wikipedia.org 的使用狀況
- pt.wikipedia.org 的使用狀況
- rm.wikipedia.org 的使用狀況
- ro.wikipedia.org 的使用狀況
- ru.wikipedia.org 的使用狀況
- sh.wikipedia.org 的使用狀況
- simple.wikipedia.org 的使用狀況
- sr.wikipedia.org 的使用狀況
- ss.wikipedia.org 的使用狀況
- sv.wikipedia.org 的使用狀況
- sw.wikipedia.org 的使用狀況
- szl.wikipedia.org 的使用狀況
- te.wikipedia.org 的使用狀況
- tg.wikipedia.org 的使用狀況
- tr.wikipedia.org 的使用狀況
- uk.wikipedia.org 的使用狀況
- xh.wikipedia.org 的使用狀況
- zu.wikipedia.org 的使用狀況