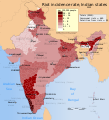
English: The map shows the incidence rate of riot complaints filed, per 100,000 people, in each state and union territory of India, in 2012. Higher number (stronger color) means either more riots in the year or more people affected by riots in that year or both.
The crime of riots is defined and covered by Sections 143-145, 147-151, 153, 153A, 153B, 157, 158 and 160 of Indian Penal Code. It is also referred to as communal violence by Indian authorities.
Kerala reported the highest riot incidence rate in 2012, while Punjab and Meghalaya reported zero riot incidence rates.
Data Source: Crime in India 2012 Statistics, National Crime Records Bureau (NCRB), Ministry of Home Affairs, Govt of India, Table 1.8, page 212.
The total communal riots and total fatalities caused by riots data for 2012 is also from the same source, NCRB. The number has been crossed verified from Government releases data of riot victims identifying religion The Times of India (September 24 2013)</ref>
The SVG code for disputed national borders in this map is a derivative work of
File:India literacy rate map en.svg available on wikimedia commons.


