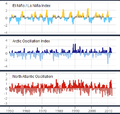
File:3 examples of internal climate variability (1950-2012), the El Niño – Southern Oscillation, the Arctic Oscillation, and the North Atlantic Oscillation (NOAA).png

页面内容不支持其他语言。
這個文件來自維基共享資源
维基百科,自由的百科全书


此diagram图片可使用矢量图形重新创建为SVG文件。这具有很多好处;更多信息请参见共享资源:待清理媒体。如果存在此图片的SVG格式,请将其上传,然后将此模板替换为{{vector version available|新图片名称}}


建议您将SVG命名为“3 examples of internal climate variability (1950-2012), the El Niño – Southern Oscillation, the Arctic Oscillation, and the North Atlantic Oscillation (NOAA).svg”,这样在使用Vector version available(或Vva)模板时就不需要填写新图片名称参数。

摘要

描述
English: This image shows three examples of internal climate variability between 1950 and 2012: the El Niño–Southern oscillation, the Arctic oscillation, and the North Atlantic oscillation (see the Intergovernmental Panel on Climate Change (IPCC, 2001) for a definition of "internal" climate variability). The El Niño – Southern Oscillation (ENSO) is a recurring climate pattern involving changes in the temperature of waters in the central and eastern tropical Pacific Ocean (NOAA Climate Program Office, 2009a). The Arctic Oscillation (AO) refers to an atmospheric circulation pattern over the mid-to-high latitudes of the Northern Hemisphere (NOAA Climate Program Office, 2009b). The North Atlantic Oscillation (or NAO) is a prominent pattern of climate variability that has a strong influence on weather over north-eastern North America, Greenland, and Europe (NOAA Climate Program Office, 2009c). The top graph shows the ENSO, the middle graph the AO, and the bottom graph the NAO.

In the top graph, the ENSO cycle is measured using the Oceanic Niño Index or ONI (for details, see NOAA Climate Program Office, 2009a). In the middle graph, the AO is measured using the Arctic Oscillation Index (for details, see NOAA Climate Program Office, 2009b). In the bottom graph, the NAO is measured using the North Atlantic Oscillation Index (for details, see NOAA Climate Program Office, 2009c).

References: IPCC, 2001: Appendix I - Glossary: Climate variability, in: Climate Change 2001: The Scientific Basis. Contribution of Working Group I to the IPCC Third Assessment Report (J.T. Houghton, et al., (eds)). Cambridge University Press; NOAA Climate Program Office, August 30, 2009a: ClimateWatch Magazine » Climate Variability: Oceanic Niño Index. NOAA; NOAA Climate Program Office, August 30, 2009b: ClimateWatch Magazine » Climate Variability: Arctic Oscillation. NOAA; NOAA Climate Program Office, August 30, 2009c: ClimateWatch Magazine » Climate Variability: North Atlantic Oscillation. NOAA.
日期
来源 NOAA Climate Services: Climate Variability (Flash object), publisher: NOAA
作者 NOAA
授权
(二次使用本文件)
Privacy Policy, Disclaimer, and Copyright Notice: ngdc.noaa.gov: "As required by 17 U.S.C. 403, third parties producing copyrighted works consisting predominantly of the material produced by U.S. government agencies must provide notice with such work(s) identifying the U.S. Government material incorporated and stating that such material is not subject to copyright protection within the United States. The information on government web pages is in the public domain and not subject to copyright protection within the United States unless specifically annotated otherwise (copyright may be held elsewhere). Foreign copyrights may apply."

许可协议

Public domain
本图像属于公有领域,因该作品最初来自于美国国家海洋和大气管理局职员的职务作品。

العربية  čeština  Deutsch  Zazaki  English  español  eesti  suomi  français  hrvatski  magyar  italiano  日本語  한국어  македонски  മലയാളം  Plattdüütsch  Nederlands  polski  português  română  русский  sicilianu  slovenščina  Türkçe  Tiếng Việt  简体中文  繁體中文  +/−

说明

添加一行文字以描述该文件所表现的内容

此文件中描述的项目

描繪內容

bad895dfaef9279cd544e805661fd66f1336f772

14,943 字节

374 像素

393 像素

文件历史

点击某个日期/时间查看对应时刻的文件。

日期/时间缩⁠略⁠图大小用户备注
当前2012年8月21日 (二) 23:032012年8月21日 (二) 23:03版本的缩略图393 × 374(15 KB)Enescot{{Information |Description ={{en|1=This image shows three examples of internal climate variability between 1950 and 2012: the El Niño – Southern Oscillation, the [[:en:Arctic Oscillation|Arctic Oscillatio...

以下2个页面使用本文件:

全域文件用途

以下其他wiki使用此文件: