
File:Per-capita-co2-aviation-adjusted.svg

原始文件 (SVG文件,尺寸为850 × 600像素,文件大小:168 KB)
摘要
| 描述 |
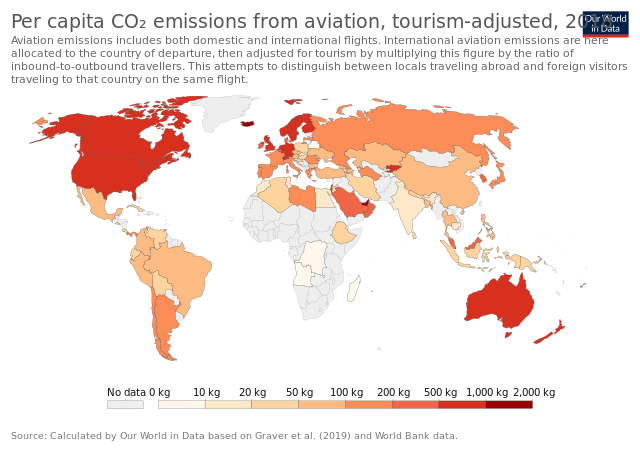
English: Per capita emissions from domestic and international flights
Let’s combine per capita emissions from domestic and international travel to compare the total footprint from flying. This is shown in the interactive map [we’ve taken the adjusted international figures – you can find the combined figures without tourism-adjustment here]. The global average emissions from aviation were 103 kilograms. The inequality in emissions across the world becomes clear when this is broken down by country. At the top of the table lies the United Arab Emirates – each person emits close to two tonnes – 1950 kg – of CO2 from flying each year. That’s 200 times the global average. This was followed by Singapore (1173 kilograms); Iceland (1070 kg); Finland (1000 kg); and Australia (878 kilograms). To put this into perspective: a return flight (in economy class) from London to Dubai/United Arab Emirates would emit around one tonne of CO2.6 So the two-tonne average for the UAE is equivalent to around two return trips to London. In many countries, most people do not fly at all. The average Indian emits just 18 kilograms from aviation – this is much, much less than even a short-haul flight which confirms that most did not take a flight. In fact, we can compare just the aviation emissions for the top countries to the total carbon footprint of citizens elsewhere. The average UAE citizen emits 1950 kilograms of CO2 from flying. This is the same as the total CO2 footprint of the average Indian (including everything from electricity to road transport, heating and industry). Or, to take a more extreme example, 200 times the total footprint of the average Nigerien, Ugandan or Ethiopian, which have per capita emissions of around 100 kilograms. This again emphasises the large difference between the global average and the individual emissions of people who fly. Aviation contributes a few percent of total CO2 emissions each year – this is not insignificant, but far from being the largest sector to tackle. Yet from the perspective of the individual, flying is often one of the largest chunks of our carbon footprint. The average rich person emits tonnes of CO2 from flying each year – this is equivalent to the total carbon footprint of tens or hundreds of people in many countries of the world. |
| 日期 | |
| 来源 | https://ourworldindata.org/carbon-footprint-flying |
| 作者 | Hannah Ritchie |
许可协议
- 您可以自由地:
- 共享 – 复制、发行并传播本作品
- 修改 – 改编作品
- 惟须遵守下列条件:
- 署名 – 您必须对作品进行署名,提供授权条款的链接,并说明是否对原始内容进行了更改。您可以用任何合理的方式来署名,但不得以任何方式表明许可人认可您或您的使用。
- 相同方式共享 – 如果您再混合、转换或者基于本作品进行创作,您必须以与原先许可协议相同或相兼容的许可协议分发您贡献的作品。
文件历史
点击某个日期/时间查看对应时刻的文件。
| 日期/时间 | 缩略图 | 大小 | 用户 | 备注 | |
|---|---|---|---|---|---|
| 当前 | 2022年7月21日 (四) 15:54 | | 850 × 600(168 KB) | PJ Geest | Uploaded a work by Hannah Ritchie from https://ourworldindata.org/carbon-footprint-flying with UploadWizard |
文件用途
以下页面使用本文件:
全域文件用途
以下其他wiki使用此文件:
- de.wikipedia.org上的用途
- en.wikipedia.org上的用途
- es.wikipedia.org上的用途