File:Podaac blob colordata sst2015.jpg

页面内容不支持其他语言。
這個文件來自維基共享資源
维基百科,自由的百科全书

原始文件(900 × 1,066像素,文件大小:267 KB,MIME类型:image/jpeg


摘要

描述
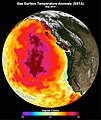
English: "This data image shows the monthly average sea surface temperature for May 2015. Between 2013 and 2016, a large mass of unusually warm ocean water--nicknamed the blob--dominated the North Pacific, indicated here by red, pink, and yellow colors signifying temperatures as much as three degrees Celsius (five degrees Fahrenheit) higher than average. Data are from the NASA Multi-scale Ultra-high Resolution Sea Surface Temperature (MUR SST) Analysis product." (Laura Naranjo "The Blob", NASA, March 15th 2019)
Deutsch: Durchschnittstemperaturen der Meeresoberfläche im Mai 2015 im Nordostpazifik, während der marinen Hitzewelle "The Blob" (2013–2016). Die Temperaturen liegen bis zu drei Grad höher als gewöhnlich.
日期
来源 Laura Naranjo "The Blob", NASA, March 15th 2019, https://earthdata.nasa.gov/user-resources/sensing-our-planet/blob
作者 NASA Physical Oceanography Distributed Active Archive Center

许可协议

Public domain 本文件完全由NASA创作,在美国属于公有领域。根据NASA的版权方针,NASA的材料除非另有声明否则不受版权保护。(参见Template:PD-USGov/zhNASA版权方针页面JPL图片使用方针。)
警告:

说明

添加一行文字以描述该文件所表现的内容
Sea surface temperatures of the North-Eastern Pacific of May 2015, during the marine heatwave known as "The Blob"

此文件中描述的项目

描繪內容

文件历史

点击某个日期/时间查看对应时刻的文件。

日期/时间缩⁠略⁠图大小用户备注
当前2019年3月29日 (五) 23:012019年3月29日 (五) 23:01版本的缩略图900 × 1,066(267 KB)DeWikiMan{{Information |description ={{en|1="This data image shows the monthly average sea surface temperature for May 2015. Between 2013 and 2016, a large mass of unusually warm ocean water--nicknamed the blob--dominated the North Pacific, indicated here by red, pink, and yellow colors signifying temperatures as much as three degrees Celsius (five degrees Fahrenheit) higher than average. Data are from the NASA Multi-scale Ultra-high Resolution Sea Surface Temperature (MUR SST) Analysis product." (L...

以下页面使用本文件:

全域文件用途

以下其他wiki使用此文件: