
File:Population curve.svg

此SVG文件的PNG预览的大小:547 × 332像素。 其他分辨率:320 × 194像素 | 640 × 388像素 | 1,024 × 622像素 | 1,280 × 777像素 | 2,560 × 1,554像素。
原始文件 (SVG文件,尺寸为547 × 332像素,文件大小:10 KB)
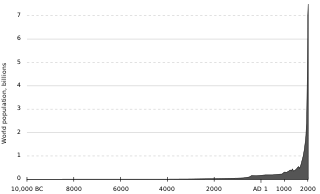
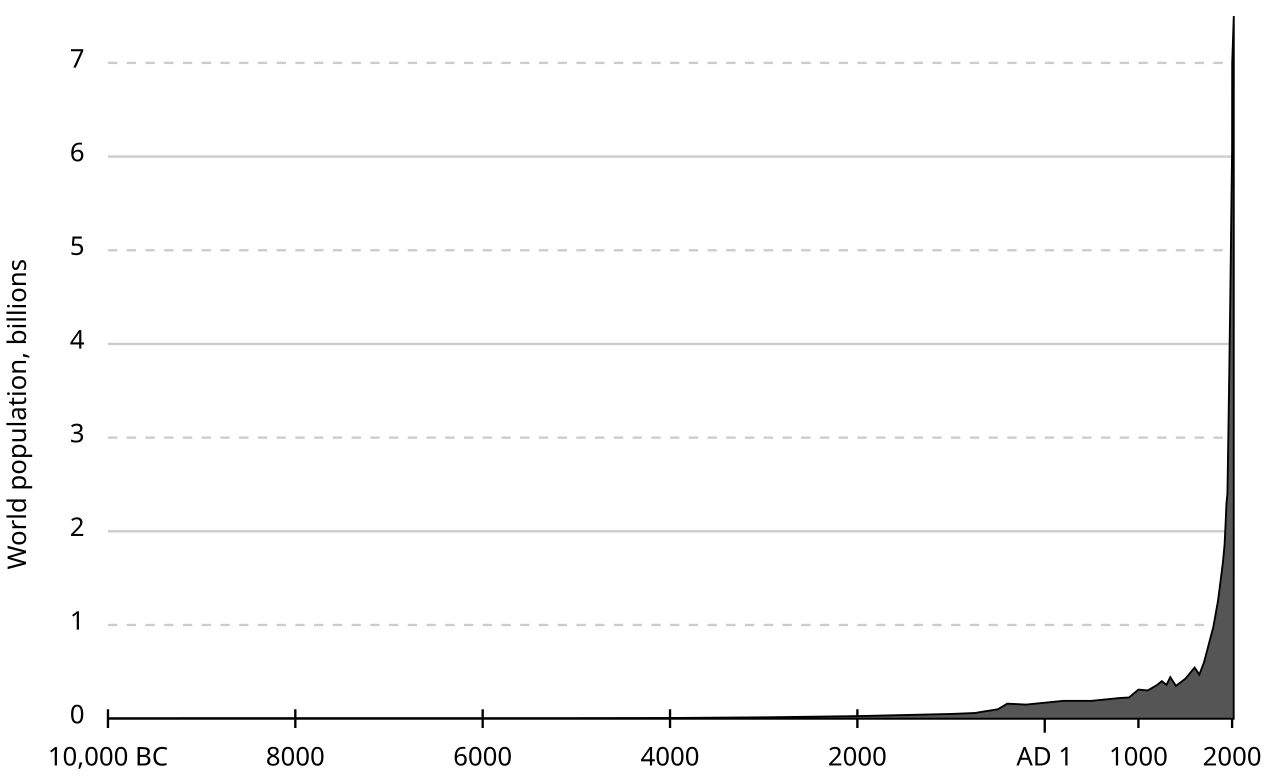
| 描述 | World human population (est.) 10,000 BC–2000 AD. |
| 来源 | originally uploaded to en.wikipedia as Population curve.svg. The data is from the "lower" estimates at census.gov (archive.org mirror). |
| 作者 | El T |
| 其他版本 | File:Population curve-ar.svg |
| 本作品已被作者英语维基百科的El T释出到公有领域。这适用于全世界。 在一些国家这可能不合法;如果是这样的话,那么: El T无条件地授予任何人以任何目的使用本作品的权利,除非这些条件是法律规定所必需的。 |
Data
year   world population (millions)
-10000 4
-8000  5
-7000  5
-6000  5
-5000  5
-4000  7
-3000  14
-2000  27
-1000  50
-750   60
-500   100
-400   160
-200   150
1      170
200    190
400    190
500    190
600    200
700    210
800    220
900    226
1000   310
1100   301
1200   360
1250   400
1300   360
1340   443
1400   350
1500   425
1600   545
1650   470
1700   600
1750   790
1800   980
1850   1260
1900   1650
1910   1750
1920   1860
1930   2070
1940   2300
1950   2400
1960   3020
1970   3700
1974   4000
1980   4430
1987   5000
1990   5260
2000   6070
2000   6500 (July 2)*
2000   6747.5 (October 2)*
2001   7000 (March 15)*
2001   7000.025 (April 21)*

*) Data points as actually plotted in 2012-05-24 revision
   (exact X axis values are 2000.5, 2000.75, 2001.2 and 2001.3)
   These are probably incorrect.
Sources
- Biraben, Jean-Noel, 1980, An Essay Concerning Mankind's Evolution, Population, Selected Papers, December, table 2.
- Durand, John D., 1974, "Historical Estimates of World Population: An Evaluation," University of Pennsylvania, Population Center, Analytical and Technical Reports, Number 10, table 2.
- Haub, Carl, 1995, "How Many People Have Ever Lived on Earth?" Population Today, February, p. 5.
- McEvedy, Colin and Richard Jones, 1978, "Atlas of World Population History," Facts on File, New York, pp. 342-351.
- Thomlinson, Ralph, 1975, "Demographic Problems, Controversy Over Population Control," Second Edition, Table 1.
- United Nations (UN), 1973, The Determinants and Consequences ofPopulation Trends, Population Studies, No. 50., p.10.
- United Nations, 1999, The World at Six Billion, Table 1, "World Population From" Year 0 to Stabilization, p. 5, http://www.un.org/esa/population/publications/sixbillion/sixbilpart1.pdf
- U.S. Census Bureau (USCB), 2008, "Total Midyear Population for the World: 1950-2050", Data updated 12-15-2008, https://www.census.gov\/ipc/www/idb/worldpop.html
文件历史
点击某个日期/时间查看对应时刻的文件。
| 日期/时间 | 缩略图 | 大小 | 用户 | 备注 | |
|---|---|---|---|---|---|
| 当前 | 2017年8月15日 (二) 22:24 | | 547 × 332(10 KB) | Gregor Hagedorn | Updating to 2017/7.5 billion |
| 2015年7月21日 (二) 09:25 |  | 550 × 325(10 KB) | JorisvS | Reverted to version as of 12:45, 24 May 2012: It breaks the text and numbers in the graph | |
| 2015年5月20日 (三) 18:44 |  | 2,500 × 1,478(15 KB) | GregKaye | moving to bronze age time scale | |
| 2012年5月24日 (四) 12:45 |  | 550 × 325(10 KB) | Spesh531 | Adding up to 7 billion, a year is .004 pixels | |
| 2006年11月10日 (五) 10:56 |  | 550 × 275(4 KB) | Dangauthier |
文件用途
全域文件用途
以下其他wiki使用此文件:
- af.wikipedia.org上的用途
- ar.wikipedia.org上的用途
- ast.wikipedia.org上的用途
- az.wikipedia.org上的用途
- be.wikipedia.org上的用途
- bg.wikipedia.org上的用途
- bn.wikipedia.org上的用途
- ca.wikipedia.org上的用途
- cs.wikipedia.org上的用途
- cs.wikinews.org上的用途
- da.wikipedia.org上的用途
- da.wikibooks.org上的用途
- de.wikipedia.org上的用途
- el.wikipedia.org上的用途
- en.wikipedia.org上的用途
- The Population Bomb
- I = PAT
- Demographic transition
- Paul R. Ehrlich
- Doomsday argument
- Environmental degradation
- Population growth
- Human impact on the environment
- Intraspecific competition
- Albert Allen Bartlett
- Andrey Korotayev
- Wikipedia:Reference desk/Archives/Humanities/2006 September 4
- Wikipedia:Reference desk/Archives/Miscellaneous/2006 October 2
- Estimates of historical world population
- Wikipedia:Graphics Lab/Images to improve/Archive/Mar 2008
- World population
- Talk:World population/Archive 1
- User talk:McSly/Archive 1
- User:Bigmadrich/sandbox
- User:I worship oil
- en.wikibooks.org上的用途
- en.wiktionary.org上的用途
- eo.wikipedia.org上的用途
查看本文件的更多全域用途。