
File:Projected changes in crop yields at different latitudes with global warming.png
原始文件 (1,322 × 694像素,文件大小:16 KB,MIME类型:image/png)
摘要
| 描述 |
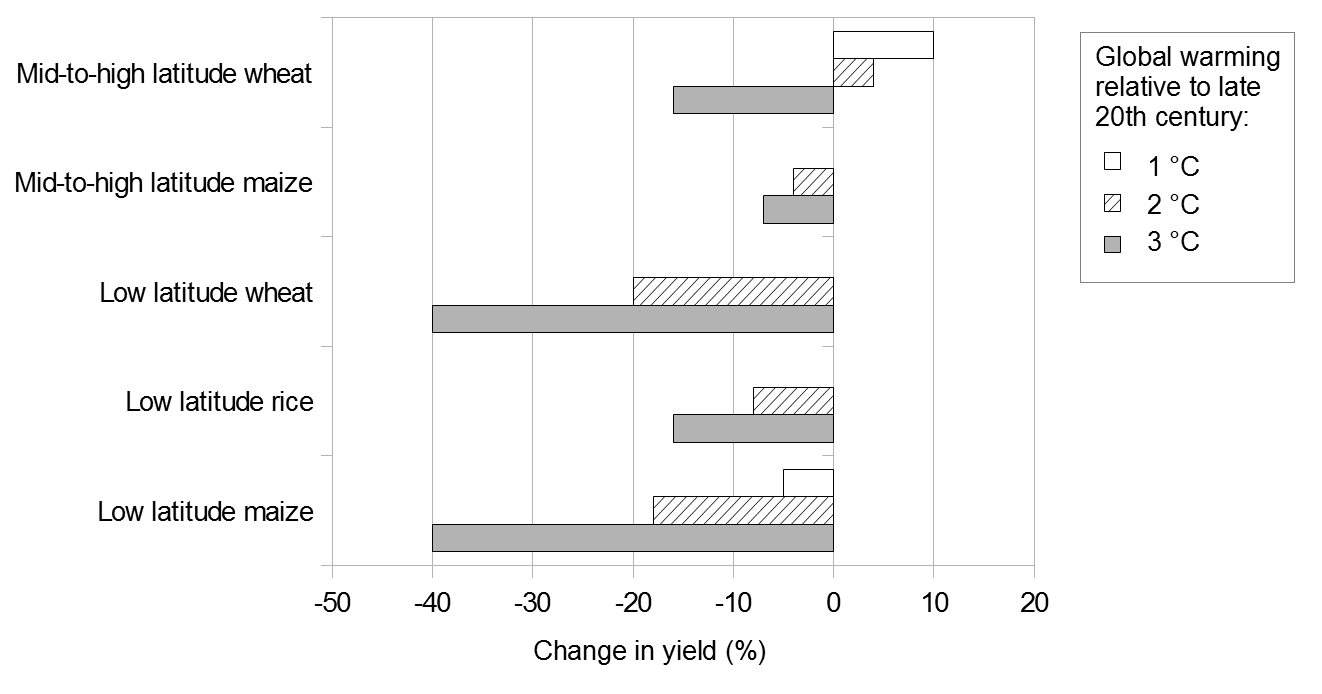
English: This bar graph shows projected changes in crop yields at different latitudes with global warming. Projected changes are shown for 1-3 °C of global warming, relative to late 20th century. For mid-to-high latitudes, changes in yield are shown for wheat and maize. For low-latitudes, changes are shown for wheat, rice and maize. In mid-to-high latitudes:
In low latitudes:
Data Values are approximate and are taken from the US National Research Council (US NRC, 2011).[1] The first, second and third numbers are the projected changes in yields (%) for 1, 2 and 3 °C of global warming, respectively.:
US NRC (2011)[1] drew on several studies. The graph does not show the "likely" ranges included in US NRC (2011).[1] The likely range means that there is a 67% chance of the projected change in yield being correct, based on expert judgement.[1] For 1 °C of global warming, the likely range is roughly equal to plus or minus (+/-) 10% for all projected changes in yields. Uncertainty increases with temperature. For 3 °C of warming, the likely range is roughly:
These projections broadly show the probable changes in regional yields.[2] The projections do not include measures to adapt to global warming.[2] Actual changes in yields may vary according to local conditions.[2] There are numerous other uncertainties, including how local climate will change with global warming, and the atmospheric concentration of carbon dioxide (CO2) associated with different magnitudes of global warming.[2] There is also the possibility that yields will change if critical thresholds are crossed.[2] Many of the uncertainties could bias the projections towards underestimating reductions in crop yields.[2] However, adaptation practices could help to reduce losses in yields.[2] Adaptation will be more difficult for higher magnitudes of warming, and may be less effective in tropical regions.[2] Notes
References
|
| 日期 | |
| 来源 | 自己的作品 |
| 作者 | Enescot |

|
此graph图片可使用矢量图形重新创建为SVG文件。这具有很多好处;更多信息请参见共享资源:待清理媒体。如果存在此图片的SVG格式,请将其上传,然后将此模板替换为
{{vector version available|新图片名称}}。
建议您将SVG命名为“Projected changes in crop yields at different latitudes with global warming.svg”,这样在使用Vector version available(或Vva)模板时就不需要填写新图片名称参数。 |
Comma-separated values
Data were exported from OpenOffice.org 3.4.1 Calc as comma-separated values (csv). The following options were used:
- Character set: Western Europe 1252
- Field delimiter: ,
- Text delimiter: "
- Quote all text cells: no
- Save cell content as shown: yes
- Fixed column width: no
,,,,,,
,,,,,,
,,,Global warming relative to late 20th century,,,
,,Region and crop,1,2,3,
,,Mid-to-high latitude wheat,10,4,-16,Changes in yield (%)
,,Mid-to-high latitude maize,0,-4,-7,
,,Low latitude wheat,0,-20,-40,
,,Low latitude rice,0,-8,-16,
,,Low latitude maize,-5,-18,-40,
许可协议
| 本作品采用知识共享CC0 1.0 通用公有领域贡献许可协议授权。 | |
| 采用本宣告发表本作品的人,已在法律允许的范围内,通过在全世界放弃其对本作品拥有的著作权法规定的所有权利(包括所有相关权利),将本作品贡献至公有领域。您可以复制、修改、传播和表演本作品,将其用于商业目的,无需要求授权。
|
文件历史
点击某个日期/时间查看对应时刻的文件。
| 日期/时间 | 缩略图 | 大小 | 用户 | 备注 | |
|---|---|---|---|---|---|
| 当前 | 2013年7月21日 (日) 13:25 | | 1,322 × 694(16 KB) | Enescot | {{Information |Description ={{en|1=This bar graph shows projected changes in crop yields at different latitudes with global warming. Projected changes are shown for 1-3&n... |
文件用途
以下页面使用本文件:
全域文件用途
以下其他wiki使用此文件:
- ar.wikipedia.org上的用途
- bn.wikipedia.org上的用途
- en.wikipedia.org上的用途
- mk.wikipedia.org上的用途
- nl.wikipedia.org上的用途