File:Usage share of alternative web browsers (Source StatCounter).svg

页面内容不支持其他语言。
這個文件來自維基共享資源
维基百科,自由的百科全书

原始文件(SVG文件,尺寸为630 × 630像素,文件大小:43 KB)


摘要

描述
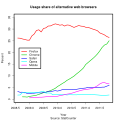
English: The graph was generated with the below R code (file name "generate.R"):
# Running:
#> setwd("[path]")
#> source("generate.R")
browser.data <- read.table("stats.txt", header=T, sep="\t")
browser.names = c("Firefox", "Chrome", "Safari", "Opera", "mobile")
browser.years = as.Date(browser.data$Date)

# http://gs.statcounter.com/#browser-ww-monthly-201109-201301
browser.firefox = browser.data$Firefox
browser.chrome = browser.data$Chrome
browser.safari = browser.data$Safari
browser.opera = browser.data$Opera
# http://gs.statcounter.com/#mobile_vs_desktop-ww-monthly-201109-201301
browser.mobile = browser.data$Mobile

browser.title = "Usage share of alternative web browsers"
browser.sub = "Source: StatCounter - Browser and Mobile vs Desktop (both monthly)"
browser.file = "Usage share of alternative web browsers (Source StatCounter).svg"


browser.maxPercent = max(browser.firefox, browser.chrome, browser.safari, browser.opera, na.rm=TRUE)
browser.maxPercent = ceiling(browser.maxPercent/10)*10

# output
svg(file=browser.file)

# lwd - thicknes of plot lines
# mar - margin in lines: bottom, left, top, right
par(lwd=3,mar=c(2,2,0,0))

# plot with title and subtitle (change mar above!)
#plot(browser.years, browser.firefox, col=2, type="l", ylim=c(0, browser.maxPercent), xlab="Year", ylab="Percent", main=browser.title, sub=browser.sub)
plot(browser.years, browser.firefox, col=2, type="l", ylim=c(0, browser.maxPercent), xlab="Year", ylab="Percent")
lines(browser.years, browser.chrome, col=3)
lines(browser.years, browser.safari, col=4)
lines(browser.years, browser.opera, col=5)
# mobile is from different source - adding different style
lines(browser.years, browser.mobile, col=6, lty=3)
 
# legend in the plot area
legend("left",inset=0.05,col=2:6,lwd=3,legend=browser.names)
 
dev.off()

Contents of stat.txt (NA = not available):

Date	Firefox	Chrome	Safari	Opera	Other	Mobile
2013-02-01	21.32	37.05	8.56	1.22	1.92	14.3
2013-01-01	21.42	36.52	8.29	1.19	1.87	14.13
2012-12-01	21.89	36.42	7.92	1.26	1.72	14.55
2012-11-01	22.37	35.72	7.83	1.39	1.46	13.08
2012-10-01	22.32	34.77	7.81	1.63	1.39	12.3
2012-09-01	22.4	34.21	7.7	1.61	1.38	12.03
2012-08-01	22.85	33.59	7.39	1.63	1.69	11.78
2012-07-01	23.73	33.81	7.12	1.72	1.58	11.09
2012-06-01	24.56	32.76	7	1.77	1.61	10.4
2012-05-01	25.55	32.43	7.09	1.77	1.04	10.11
2012-04-01	24.87	31.23	7.13	1.72	0.98	9.58
2012-03-01	24.98	30.87	6.72	1.78	0.82	8.99
2012-02-01	24.88	29.84	6.77	2.02	0.73	8.53
2012-01-01	24.78	28.4	6.62	1.95	0.79	8.49
2011-12-01	25.27	27.27	6.08	1.98	0.75	8.04
2011-11-01	25.23	25.69	5.92	1.82	0.71	6.95
2011-10-01	26.39	25	5.93	1.81	0.69	6.55
2011-09-01	26.79	23.61	5.6	1.72	0.62	6.74
2011-08-01	27.49	23.16	5.19	1.67	0.61	7.12
2011-07-01	27.95	22.14	5.17	1.66	0.63	7.02
2011-06-01	28.34	20.65	5.07	1.74	0.61	6.53
2011-05-01	29.29	19.36	5.01	1.84	0.63	5.75
2011-04-01	29.67	18.29	5.04	1.91	0.57	5.21
2011-03-01	29.98	17.37	5.02	1.97	0.54	4.7
2011-02-01	30.37	16.54	5.08	2	0.55	4.45
2011-01-01	30.68	15.68	5.09	2	0.55	4.3
2010-12-01	30.76	14.85	4.79	2.07	0.58	4.1
2010-11-01	31.17	13.35	4.7	2.01	0.6	4.02
2010-10-01	31.24	12.39	4.56	2	0.6	3.81
2010-09-01	31.5	11.54	4.42	2.03	0.63	3.5
2010-08-01	31.09	10.76	4.23	1.88	0.7	3.21
2010-07-01	30.69	9.88	4.09	1.91	0.74	2.86
2010-06-01	31.15	9.24	4.07	1.91	0.77	2.57
2010-05-01	31.64	8.61	4.14	1.96	0.88	2.32
2010-04-01	31.74	8.06	4.23	1.82	0.89	2.18
2010-03-01	31.27	7.29	4.16	1.97	0.87	1.96
2010-02-01	31.82	6.72	4.08	1.97	0.91	1.72
2010-01-01	31.64	6.04	3.76	2	1.31	1.56
2009-12-01	31.97	5.45	3.48	2.06	1.31	1.28
2009-11-01	32.21	4.66	3.67	2.02	0.86	1.21
2009-10-01	31.82	4.17	3.47	1.88	0.7	1.15
2009-09-01	31.34	3.69	3.28	2.62	0.7	1.12
2009-08-01	31.28	3.38	3.25	2.67	0.73	1.12
2009-07-01	30.5	3.01	3.02	2.64	0.72	1.05
2009-06-01	30.33	2.82	2.93	3.36	1.07	0.94
2009-05-01	28.75	2.42	2.65	3.23	0.87	0.86
2009-04-01	29.67	2.07	2.75	2.96	0.68	0.86
2009-03-01	29.4	1.73	2.73	2.94	0.68	0.8
2009-02-01	27.85	1.52	2.59	2.95	0.67	0.69
2009-01-01	27.03	1.38	2.57	2.92	0.7	0.67
2008-12-01	25.23	1.21	2.41	2.83	0.48	0.6
2008-11-01	25.27	0.93	2.49	3.01	0.16	NA
2008-10-01	25.54	1.02	2.91	2.69	0.17	NA
2008-09-01	25.77	1.03	3	2.86	0.18	NA
2008-08-01	26.08	NA	2.99	1.83	0.2	NA
2008-07-01	26.14	NA	3.3	1.78	0.21	NA
Note that StatCounter doesn't clearly state how does it calculate monthly stats.
日期
来源 自己的作品, data from StatCounter Browser (monthly) and Mobile vs Desktop (monthly)
作者 Daniel.Cardenas, Maciej "Nux" Jaros

许可协议

我,本作品著作权人,特此采用以下许可协议发表本作品:
w:zh:知识共享
署名
本文件采用知识共享署名 3.0 未本地化版本许可协议授权。
您可以自由地:
  • 共享 – 复制、发行并传播本作品
  • 修改 – 改编作品
惟须遵守下列条件:
  • 署名 – 您必须对作品进行署名,提供授权条款的链接,并说明是否对原始内容进行了更改。您可以用任何合理的方式来署名,但不得以任何方式表明许可人认可您或您的使用。

说明

添加一行文字以描述该文件所表现的内容

此文件中描述的项目

描繪內容

文件历史

点击某个日期/时间查看对应时刻的文件。

日期/时间缩⁠略⁠图大小用户备注
当前2013年2月23日 (六) 15:312013年2月23日 (六) 15:31版本的缩略图630 × 630(43 KB)Nux{{Information |Description ={{en|1=-}} |Source =- |Author =- |Date = |Permission = |other_versions = }} clear indication of mobile being different
2013年2月23日 (六) 15:212013年2月23日 (六) 15:21版本的缩略图630 × 630(43 KB)Nux{{Information |Description ={{en|1=-}} |Source =- |Author =- |Date = |Permission = |other_versions = }} no titles
2013年2月23日 (六) 13:462013年2月23日 (六) 13:46版本的缩略图630 × 630(86 KB)Nux{{Information |Description ={{en|1=212}} {{pl|1=121}} |Source =StatCounter - stats named "Browser" and "Mobile vs Desktop" (both monthly) |Author =1212 |Date = |Permission = |other_versions = }}
2011年11月12日 (六) 06:112011年11月12日 (六) 06:11版本的缩略图630 × 630(55 KB)Daniel.CardenasAdd Sept and Oct
2011年9月3日 (六) 23:312011年9月3日 (六) 23:31版本的缩略图630 × 630(55 KB)Daniel.CardenasAdd July and August
2011年7月17日 (日) 21:182011年7月17日 (日) 21:18版本的缩略图630 × 630(55 KB)Daniel.Cardenas

没有页面链接到本图像。

全域文件用途

以下其他wiki使用此文件:

元数据