
File:WeierstrassFunction.svg

此SVG文件的PNG预览的大小:795 × 505像素。 其他分辨率:320 × 203像素 | 640 × 407像素 | 1,024 × 650像素 | 1,280 × 813像素 | 2,560 × 1,626像素。
原始文件 (SVG文件,尺寸为795 × 505像素,文件大小:120 KB)
摘要
| 描述 |
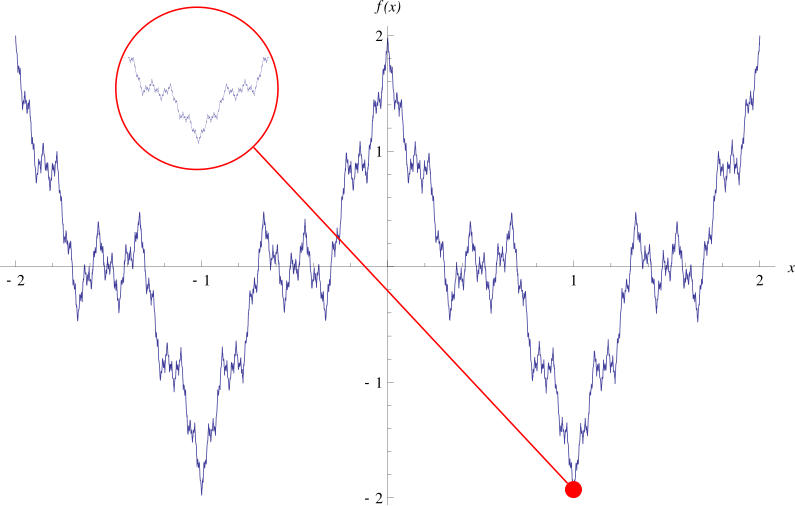
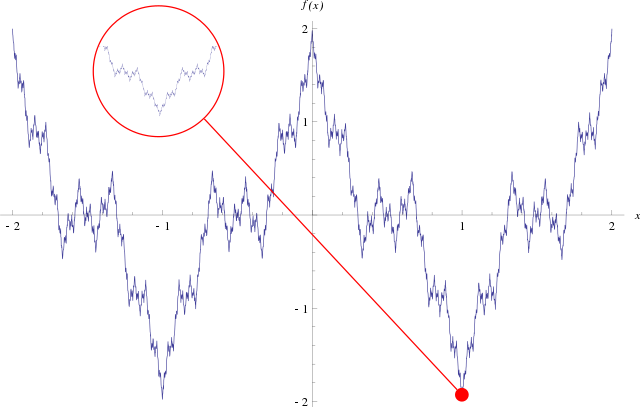
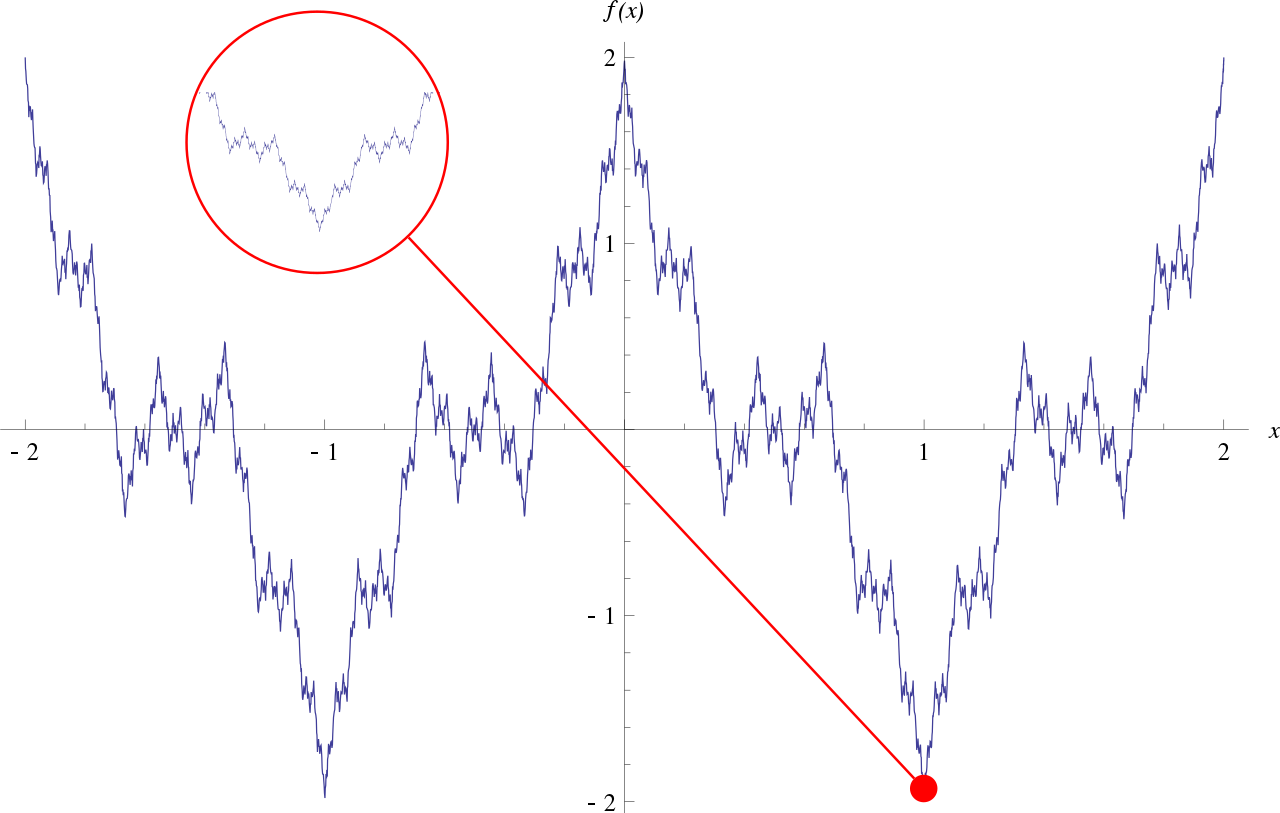
English: Plot of the Weierstrass function. A section of the plot is zoomed in on to illustrate the fractal nature of the function. The plot was generated using Mathematica and exported to SVG. I first made a plot of the region and then a plot of a much smaller section around the red point on the image. With the use of Inkscape, I was able to put the two in the same SVG file. This file is an Inkscape SVG, not a plain SVG. |
| 日期 | |
| 来源 | 自己的作品 |
| 作者 | Eeyore22 |
| 其他版本 | File:Weierstrass_function.gif |
W3C-validity not checked.
许可协议
| 我,本作品著作权人,释出本作品至公有领域。这适用于全世界。 在一些国家这可能不合法;如果是这样的话,那么: 我无条件地授予任何人以任何目的使用本作品的权利,除非这些条件是法律规定所必需的。 |
文件历史
点击某个日期/时间查看对应时刻的文件。
| 日期/时间 | 缩略图 | 大小 | 用户 | 备注 | |
|---|---|---|---|---|---|
| 当前 | 2008年10月27日 (一) 00:44 | | 795 × 505(120 KB) | Eeyore22~commonswiki | {{Information |Description={{en|1=Plot of the Weierstrass function. A section of the plot is zoomed in on to illustrate the fractal nature of the function.}} |Source=Own work by uploader |Author=Eeyore22 |Date=October 26, 2008 |Permissio |
文件用途
全域文件用途
以下其他wiki使用此文件:
- ar.wikipedia.org上的用途
- bg.wikipedia.org上的用途
- ca.wikipedia.org上的用途
- cs.wikipedia.org上的用途
- cv.wikipedia.org上的用途
- de.wikipedia.org上的用途
- de.wikiversity.org上的用途
- Kurs:Mathematik für Anwender (Osnabrück 2011-2012)/Teil I/Vorlesung 15
- Kurs:Mathematik für Anwender (Osnabrück 2011-2012)/Teil I/Vorlesung 15/kontrolle
- Kurs:Analysis (Osnabrück 2013-2015)/Teil I/Vorlesung 12
- Kurs:Analysis (Osnabrück 2014-2016)/Teil I/Vorlesung 12
- Kurs:Analysis (Osnabrück 2014-2016)/Teil I/Vorlesung 12/kontrolle
- Kurs:Grundkurs Mathematik (Osnabrück 2016-2017)/Teil II/Vorlesung 51
- Kurs:Grundkurs Mathematik (Osnabrück 2016-2017)/Teil II/Vorlesung 51/kontrolle
- Kurs:Grundkurs Mathematik (Osnabrück 2018-2019)/Teil II/Vorlesung 51
- Kurs:Grundkurs Mathematik (Osnabrück 2018-2019)/Teil II/Vorlesung 51/kontrolle
- Kurs:Mathematik für Anwender (Osnabrück 2019-2020)/Teil I/Vorlesung 10
- Kurs:Mathematik für Anwender (Osnabrück 2019-2020)/Teil I/Vorlesung 10/kontrolle
- Kurs:Mathematik für Anwender (Osnabrück 2019-2020)/Teil I/Repetitorium/Vorlesung 10
- Kurs:Mathematik für Anwender (Osnabrück 2020-2021)/Teil I/Vorlesung 10
- Kurs:Mathematik für Anwender (Osnabrück 2020-2021)/Teil I/Vorlesung 10/kontrolle
- Kurs:Analysis (Osnabrück 2021-2023)/Teil I/Vorlesung 12
- Stetige Funktion/K/Motivation/Einführung/Textabschnitt
- Kurs:Analysis (Osnabrück 2021-2023)/Teil I/Vorlesung 12/kontrolle
- Kurs:Grundkurs Mathematik (Osnabrück 2022-2023)/Teil II/Vorlesung 51
- Kurs:Grundkurs Mathematik (Osnabrück 2022-2023)/Teil II/Vorlesung 51/kontrolle
- Kurs:Analysis (Osnabrück 2013-2015)/Teil I/Vorlesung 12/kontrolle
- Reelle Zahlen/Stetige Funktionen/Motivation/Einführung/Textabschnitt
- Kurs:Maßtheorie auf topologischen Räumen/Differenzierbarkeit in Analysis und Funktiontheorie
- Reelle Funktionen/Stetig/Einführung/Textabschnitt
- Kurs:Mathematik für Anwender (Osnabrück 2023-2024)/Teil I/Vorlesung 10
- Kurs:Mathematik für Anwender (Osnabrück 2023-2024)/Teil I/Vorlesung 10/kontrolle
- el.wikipedia.org上的用途
- en.wikipedia.org上的用途
- en.wikibooks.org上的用途
- en.wikiversity.org上的用途
- Real numbers/Continuous functions/Motivation/Introduction/Section
- Mathematics for Applied Sciences (Osnabrück 2023-2024)/Part I/Lecture 10
- Mathematics for Applied Sciences (Osnabrück 2023-2024)/Part I/Lecture 10/latex
- Mathematics for Applied Sciences (Osnabrück 2023-2024)/Part I/Lecture 10/refcontrol
- en.wiktionary.org上的用途
- es.wikipedia.org上的用途
- et.wikipedia.org上的用途
- eu.wikipedia.org上的用途
- fa.wikipedia.org上的用途
- fr.wikipedia.org上的用途
查看本文件的更多全域用途。