
File:Halogenated gas concentrations 1978-present.png
預覽大小:800 × 516 像素。 其他解析度:320 × 206 像素 | 640 × 412 像素 | 928 × 598 像素。
原始檔案 (928 × 598 像素,檔案大小:24 KB,MIME 類型:image/png)
摘要

|
This file may be updated to reflect new information. If you wish to use a specific version of the file without it being overwritten, please upload the required version as a separate file. |
| 描述 |
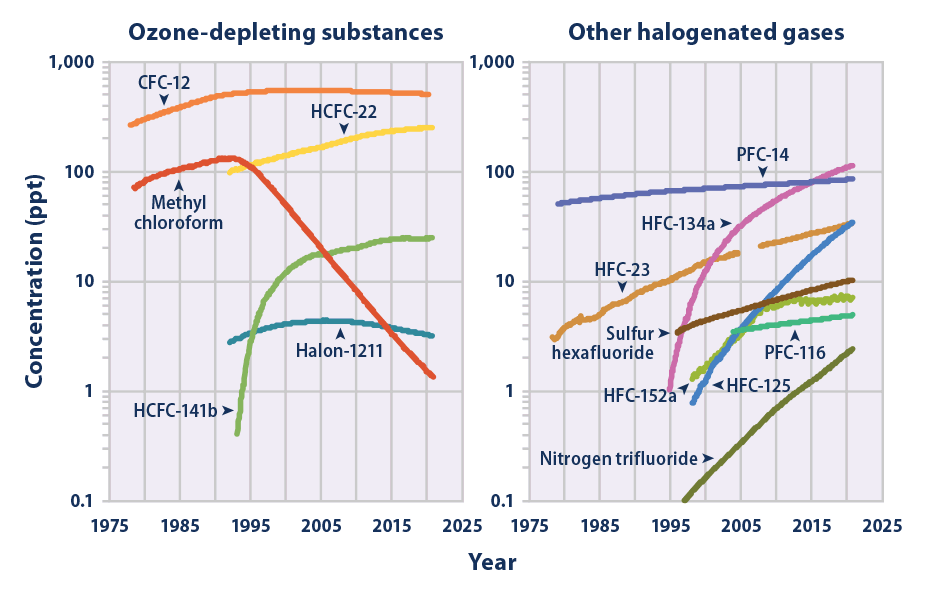
English: The two graphs show global changes in the concentration (measured in parts per trillion, or ppt) of several important halogenated gases in Earth's atmosphere. The data were collected from sites around the world between years 1978 and 2021. The left graph shows gases which cause substantial ozone depletion, as well as atmospheric heating. The right graph shows gases whose main impact is global warming.
All of the gases are human-made and manufactured in industrial amounts starting as early as the mid-twentieth century. Severe depletion of Earth's protective ozone layer inspired efforts to reduce the production of some gases starting the late 1980s. Overall, the manufacture of most other gases is still rapidly increasing, as indicated by the logarithmic scale used to graph the concentrations. Data Sources/References:
|
| 日期 | |
| 來源 | https://www.epa.gov/climate-indicators/climate-change-indicators-atmospheric-concentrations-greenhouse-gases |
| 作者 | United States Environmental Protection Agency - Unauthored |
授權條款
本圖像屬於公有領域,因該作品最初來自於美國國家海洋和大氣管理局職員的職務作品。
|
檔案歷史
點選日期/時間以檢視該時間的檔案版本。
| 日期/時間 | 縮圖 | 尺寸 | 使用者 | 備註 | |
|---|---|---|---|---|---|
| 目前 | 2022年8月29日 (一) 06:37 | | 928 × 598(24 KB) | A876 | updated by author to cover 1978-2021. |
| 2022年4月15日 (五) 00:03 |  | 928 × 598(24 KB) | A876 | compacted. octree from RGB (3348 colors) (no noticeable change) to 256 colors. zopfli png compression (lossless). | |
| 2022年4月14日 (四) 23:49 |  | 928 × 598(74 KB) | A876 | updated by author to cover 1978-2018. (includes ALL of the previous version (1978-2015), so REPLACING it is no loss.) | |
| 2020年9月25日 (五) 17:05 |  | 928 × 598(77 KB) | Bikesrcool | Uploaded a work by United States Environmental Protection Agency - Unauthored from https://www.epa.gov/climate-indicators/climate-change-indicators-atmospheric-concentrations-greenhouse-gases with UploadWizard |
檔案用途
下列頁面有用到此檔案:
全域檔案使用狀況
以下其他 wiki 使用了這個檔案:
- bn.wikipedia.org 的使用狀況
- ca.wikipedia.org 的使用狀況
- en.wikipedia.org 的使用狀況
- es.wikipedia.org 的使用狀況
- fr.wikipedia.org 的使用狀況
- it.wikipedia.org 的使用狀況