
File:Phase shifter using IQ modulator.gif
預覽大小:800 × 361 像素。 其他解析度:320 × 144 像素 | 842 × 380 像素。
原始檔案 (842 × 380 像素,檔案大小:1.57 MB,MIME 類型:image/gif、循環、72 畫格、8.6秒)
摘要
| 描述 |
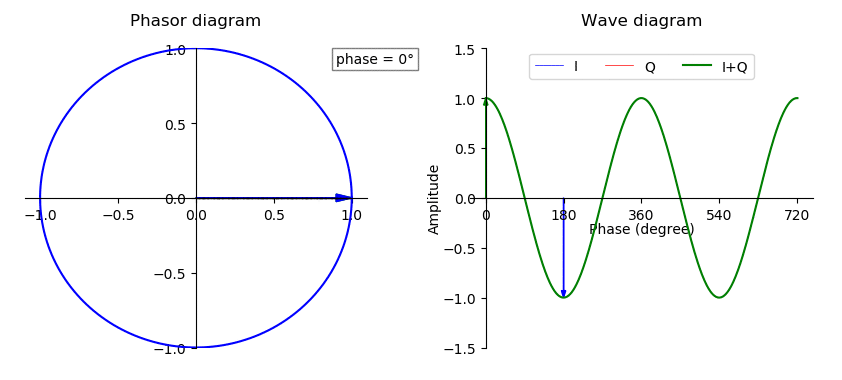
English: Phasor and wave diagram animation showing how phase change is achieved in I+Q signal by changing I (inphase cosine component) and Q (quadrature sine component) signals amplitude in IQ modulators. For Python code used to generate this image, go to the image file description page by clicking "More details" button. |
| 日期 | |
| 來源 | 自己的作品 |
| 作者 | Vigneshdm1990 |
Source code Python Matplotlib
The following python code is used to generate 72 images used in this animation. Then using an online gif image maker "ezgif.com" these 72 images are combined to get gif image.
# Python code using matplotlib library to generate 72 images to create a gif file that shows
# how phase change is achieved by changing I and Q signals amplitude in IQ modulators
#
# I- inphase Q-quadrature

# Physics concept : how by only changing the magnitude of I and Q signals amplitude
# one can change the phase of I+Q wave signal

import matplotlib.pyplot as plt
import numpy as np

# t is the current phase, and phase is changed from 0° to 355° in the steps of 5°

for t in range(0,356,5):

    # I) CREATING FUNCTION FOR PLOTTING

    # creating a blue circle in PHASOR DIAGRAM using parametric equation (radius=1, theta=s)
    s=np.linspace(0, 2 * np.pi, 400)
    x1=np.cos(s)
    y1=np.sin(s)

    # creating I and Q vectors magnitude (x=I, y=Q) in PHASOR DIAGRAM
    x = 1*np.cos(0.0174533*t)
    y = 1*np.sin(0.0174533*t)

    # creating I, Q, I+Q amplitude and Phase (0° to 720°) for WAVE DIAGRAM
    x2 = np.linspace(0, 721, 400) # Pahse from 0° to 720° divided into 400 points
    y2 = 1*np.sin(0.0174533*t)*np.sin(0.0174533*x2) # Q
    z2 = 1*np.cos(0.0174533*t)*np.cos(0.0174533*x2) # I
    q2 = (y2 + z2) # (I+Q)

    # creating text to show current phase t
    text1 = "phase = " + str(t)+'°'

    # II) CREATING THE PLOT (phasor and wave diagram in one plot arranged 1 x 2)

    # ax1 = Phasor diagram subplot and ax2 = Wave diagram subplot
    fig, (ax1, ax2) = plt.subplots(1, 2, figsize=(9.5,4.1))
    ax1.title.set_text('Phasor diagram')
    ax2.title.set_text('Wave diagram')

    # Setting the position of the subplot title
    ax1.title.set_position([.5, 1.05])
    ax2.title.set_position([.5, 1.05])

    # II-A) PHASOR DIAGRAM

    # including the current phase inside the Phasor diagram subplot
    ax1.text(0.9, 0.9, text1, bbox=dict(boxstyle="square",facecolor='white', alpha=0.5))

    # setting the y axis limit
    ax1.set_ylim(-1, 1)

    # Plotting the blue outer circle of radius = 1
    ax1.plot(x1, y1, 'b')

    # Move left y-axis and bottom x-axis to centre, passing through (0,0)
    ax1.spines['left'].set_position('center')
    ax1.spines['bottom'].set_position('center')

    # Eliminate upper and right axes
    ax1.spines['right'].set_color('none')
    ax1.spines['top'].set_color('none')

    # Show ticks in the left and lower axes only
    ax1.xaxis.set_ticks_position('bottom')
    ax1.yaxis.set_ticks_position('left')

    # Setting the y axis ticks at (-1,-0.5,0,0.5,1)
    ax1.set_yticks([-1,-0.5,0,0.5,1])

    # Creating Arrows and dashed lines
    ax1.arrow(0, 0, x, y, length_includes_head='True', head_width=0.05, head_length=0.1, color='g') # I+Q
    ax1.arrow(0, 0, x, 0, length_includes_head='True', head_width=0.05, head_length=0.1, color='b') # I
    ax1.arrow(0, 0, 0, y, length_includes_head='True', head_width=0.05, head_length=0.1, color='r') # Q
    ax1.arrow(x, 0, 0, y, length_includes_head='True', head_width=0, head_length=0, ls='-.') # vertical dashed lines
    ax1.arrow(0, y, x, 0, length_includes_head='True', head_width=0, head_length=0, ls='-.') # Horizontal dashed lines

    # II-B) WAVE DIAGRAM

    # setting the y axis limit
    ax2.set_ylim(-1.5, 1.5)

    # Setting the y axis ticks at (0, 180, 360, 540, 720) degree phase
    ax2.set_xticks([0, 180, 360, 540, 720])

    # Setting the position of the x and y axis
    ax2.spines['left'].set_position(('axes', 0.045))
    ax2.spines['bottom'].set_position(('axes', 0.5))

    # Eliminate upper and right axes
    ax2.spines['right'].set_color('none')
    ax2.spines['top'].set_color('none')

    # Creating x and y axis label
    ax2.set_xlabel('Phase (degree)', labelpad=0)
    ax2.set_ylabel('Amplitude', labelpad=0)

    # Plotting I, Q and I+Q waves
    ax2.plot(x2, z2, 'b', label='I', linewidth=0.5)
    ax2.plot(x2, y2, 'r', label='Q', linewidth=0.5)
    ax2.plot(x2, q2, 'g', label='I+Q')

    # function for amplitude of I+Q green arrow
    c1=1 * np.cos(0.0174533 * t) * np.cos(0.0174533 * t)+1*np.sin(0.0174533*t)*np.sin(0.0174533*t)

    # plotting I+Q arrow that moves along to show the current phase
    ax2.arrow(t, 0, 0, c1, length_includes_head='True', head_width=10, head_length=0.07, color='g')

    # plotting I and Q amplitude arrows at position 180° and 90° respectively
    ax2.arrow(180, 0, 0, 1*np.cos(0.0174533*t)*np.cos(0.0174533*180), length_includes_head='True', head_width=10, head_length=0.07, color='b')
    ax2.arrow(90, 0, 0, 1*np.sin(0.0174533*t)*np.sin(0.0174533*90), length_includes_head='True', head_width=10, head_length=0.07, color='r')

    # Creating legend
    ax2.legend(loc='center', ncol=3, bbox_to_anchor=[0.5, 0.94])

    # Adjusting the relative position of the subplots inside the figure
    fig.subplots_adjust(left=0.07, bottom=0.15, right=None, top=None, wspace=0.3, hspace=None)

    # Saving the figure
    fig.savefig('0file%s.png' %t)

    # Clearing the figure for the next iteration
    fig.clf()
授權條款
我,本作品的著作權持有者,決定用以下授權條款發佈本作品:
此檔案採用創用CC 姓名標示-相同方式分享 4.0 國際授權條款。
- 您可以自由:
- 分享 – 複製、發佈和傳播本作品
- 重新修改 – 創作演繹作品
- 惟需遵照下列條件:
- 姓名標示 – 您必須指名出正確的製作者,和提供授權條款的連結,以及表示是否有對內容上做出變更。您可以用任何合理的方式來行動,但不得以任何方式表明授權條款是對您許可或是由您所使用。
- 相同方式分享 – 如果您利用本素材進行再混合、轉換或創作,您必須基於如同原先的相同或兼容的條款,來分布您的貢獻成品。
檔案歷史
點選日期/時間以檢視該時間的檔案版本。
| 日期/時間 | 縮圖 | 尺寸 | 使用者 | 備註 | |
|---|---|---|---|---|---|
| 目前 | 2020年2月2日 (日) 21:26 | | 842 × 380(1.57 MB) | Vigneshdm1990 | User created page with UploadWizard |
檔案用途
下列頁面有用到此檔案:
全域檔案使用狀況
以下其他 wiki 使用了這個檔案:
- ca.wikipedia.org 的使用狀況
- en.wikipedia.org 的使用狀況
- fa.wikipedia.org 的使用狀況