
File:Projected impact of climate change on agricultural yields by the 2080s, compared to 2003 levels (Cline, 2007).png
預覽大小:800 × 536 像素。 其他解析度:320 × 215 像素 | 640 × 429 像素 | 1,024 × 686 像素 | 1,280 × 858 像素 | 2,008 × 1,346 像素。
原始檔案 (2,008 × 1,346 像素,檔案大小:68 KB,MIME 類型:image/png)
.png?uselang=zh-hant)
.png?uselang=zh-hant)
.png?action=history&uselang=zh-hant)
.png)
摘要
| 描述 |
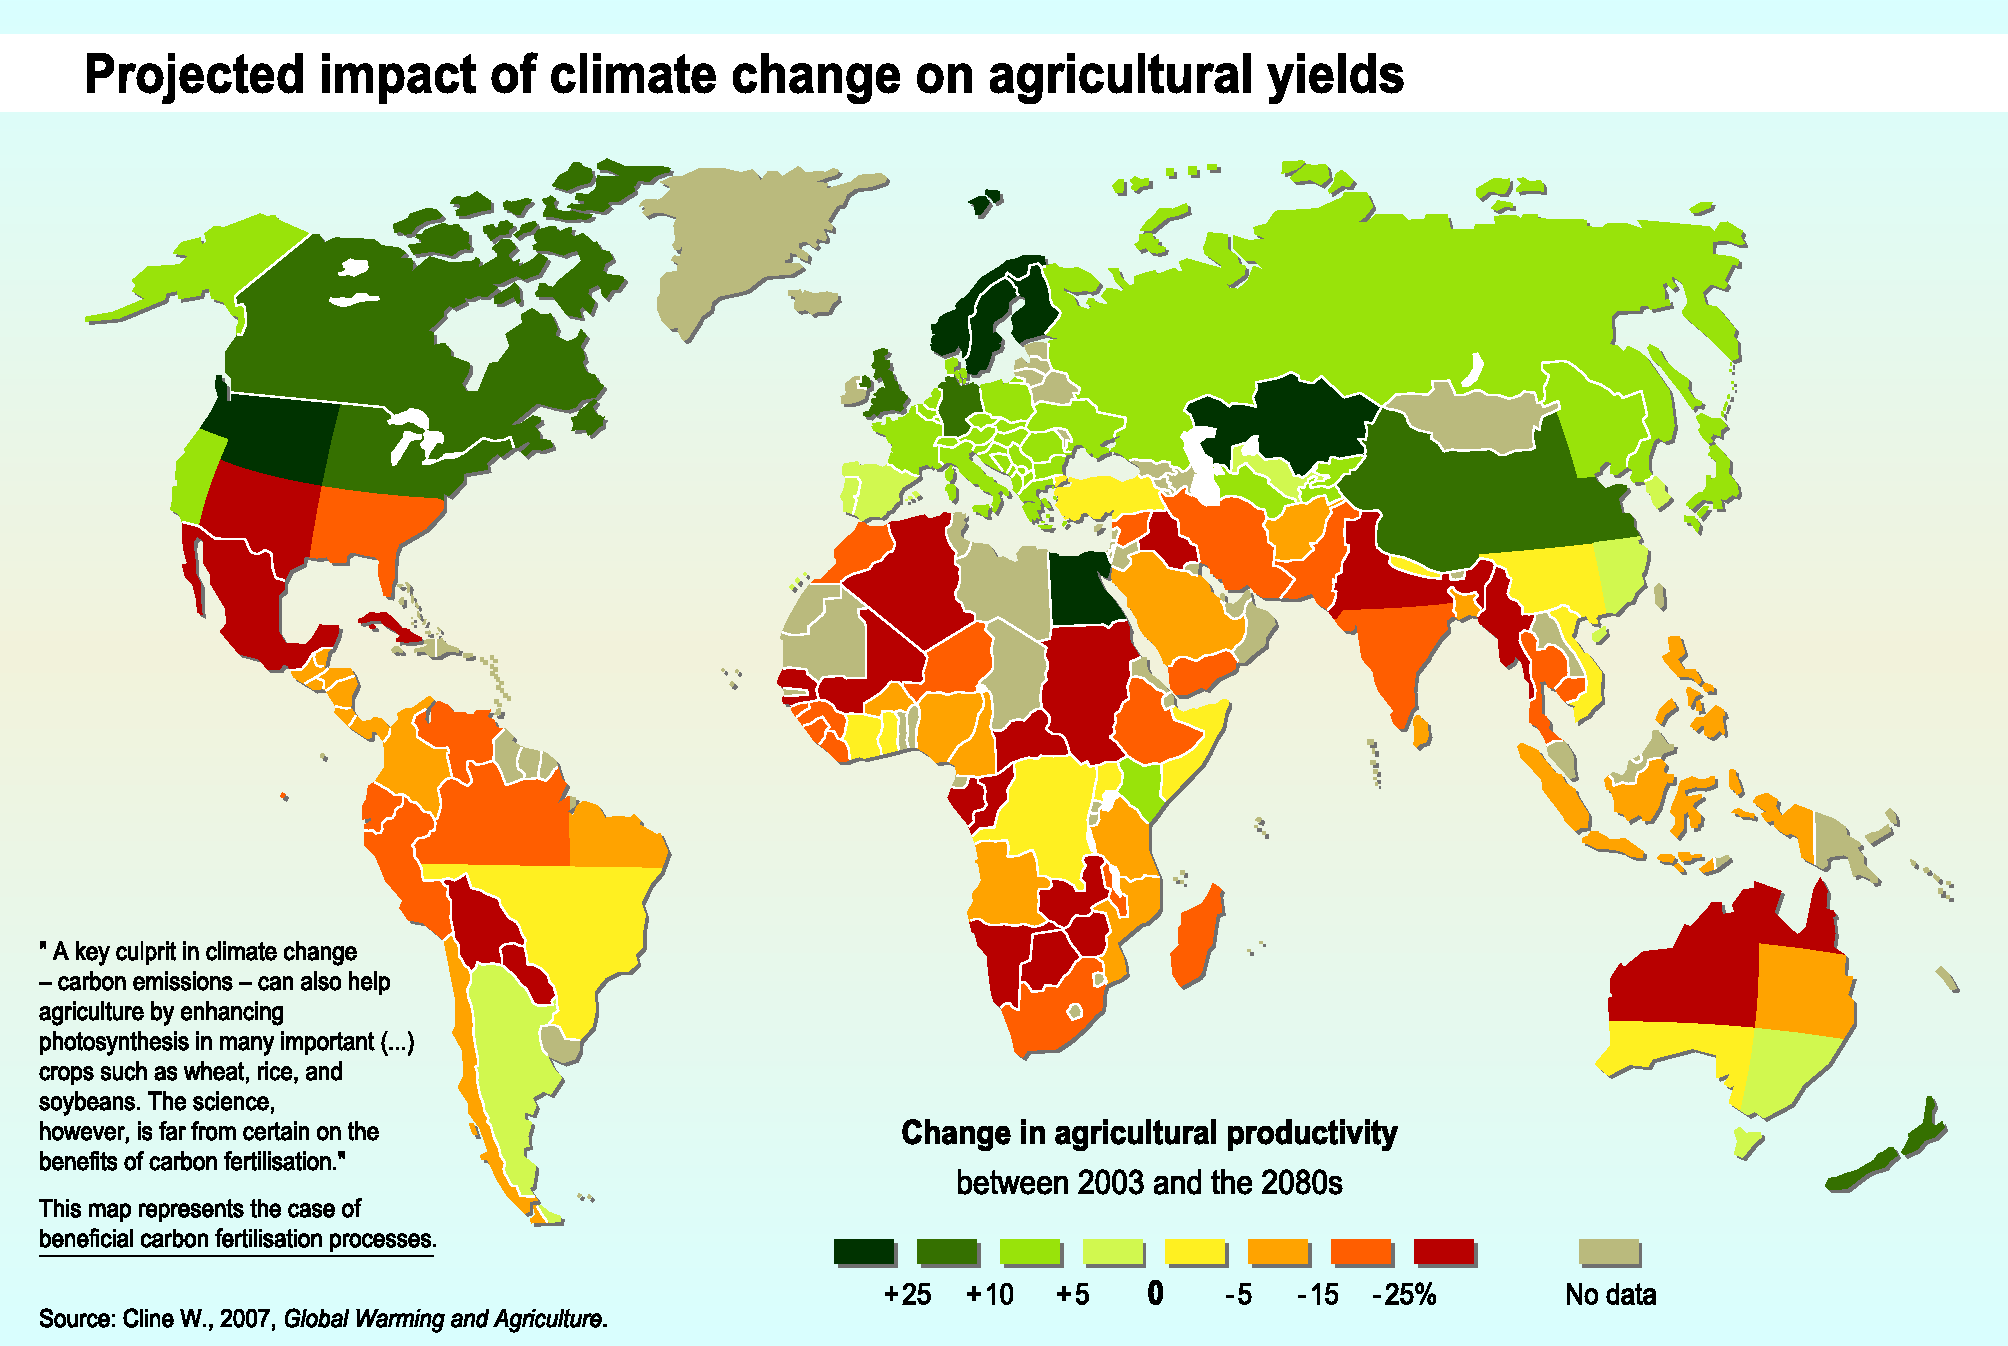
English: This map shows the projected impact of climate change in the 2080s on agricultural productivity across the world. Impacts are measured as a percentage change in agricultural productivity compared to 2003 levels. It is based on work by Cline (2007) (referred to by the European Environment Agency (EEA), 2011, pp.74-75). Cline (2008) also provides details of the study and can be freely downloaded. According to the EEA (2011, p.74): "Although global production may increase initially (before 2030), global warming is projected to have negative effects in the long run. While production at high latitudes will generally benefit from climate change, in many African countries and Latin America it is projected to be severely compromised [...]." The map represents a "business-as-usual" scenario, i.e., the world adopts no new measures to reduce greenhouse gas emissions (EEA, 2011, p.75). It takes into account the assumed benefits of increases in carbon fertilization (EEA, 2011, p.75). Calculations are based on the average output of six general circulation models (GCMs) of the Earth's climate system (EEA, 2011, p.75). Raw data on which the map is based can be downloaded as an Excel spreadsheet from the source website (EEA, 2010). References: Cline, W.R., (2007): Global Warming and Agriculture: Impact Estimates by Country. Center for Global Development, Washington DC ,USA; Cline, W.R., (March 2008): Global Warming and Agriculture. Finance and Development, vol 45, no. 1. International Monetary Fund, Washington DC, USA; EEA, (2011): The European environment — state and outlook 2010: assessment of global megatrends. European Environment Agency, Copenhagen, Denmark. |
| 日期 | |
| 來源 | EEA (14 December 2010): Projected impact of climate change on agricultural yields. European Environment Agency, Copenhagen, Denmark. Last modified September 5, 2011. |
| 作者 | European Environment Agency, Copenhagen, Denmark |
| 授權許可 (重用此檔案) |
From original source: "EEA standard re-use policy: unless otherwise indicated, re-use of content on the EEA website for commercial or non-commercial purposes is permitted free of charge, provided that the source is acknowledged (http://www.eea.europa.eu/legal/copyright). Copyright holder: European Environment Agency." |
授權條款
This image is in the public domain because it is extracted from the European Environment Agency Website, whose material is in the public domain unless otherwise stated (see the copyright notice). Online access: www.eea.eu.int
This is valid despite the copyright notice at the bottom of each page, see this confirmation e-mail. | |

|
本圖片是以PNG、GIF或JPEG格式上傳。然而,其中包含的資料或訊息,應該重新建立成可縮放向量圖形(SVG)檔案,以更有效率或更準確的方式儲存。如有可能,請上傳本圖片的SVG格式版本。在上傳之後,請修改維基各姊妹計畫中所有使用舊版圖片的條目(列在圖像連結章節中),替換為新版圖片,並在舊圖片的描述頁中加入{{Vector version available|新圖片名稱.svg}}模板,同時移除本模板。
|
檔案歷史
點選日期/時間以檢視該時間的檔案版本。
| 日期/時間 | 縮圖 | 尺寸 | 使用者 | 備註 | |
|---|---|---|---|---|---|
| 目前 | 2016年9月25日 (日) 22:00 | | 2,008 × 1,346(68 KB) | SteinsplitterBot | Bot: Image rotated by 180° |
| 2016年9月9日 (五) 00:00 |  | 2,008 × 1,346(69 KB) | SteinsplitterBot | Bot: Image rotated by 180° | |
| 2012年7月16日 (一) 21:26 |  | 2,008 × 1,346(106 KB) | Enescot | {{Information |Description ={{en|1=This map shows the projected impact of climate change in the 2080s on agricultural productivity across the world. Impacts are measured as a percentage change in agricultural productivity compared to 2003 levels. It... |
檔案用途
下列2個頁面有用到此檔案:
全域檔案使用狀況
以下其他 wiki 使用了這個檔案:
- bn.wikipedia.org 的使用狀況
- ca.wikipedia.org 的使用狀況
- cs.wikipedia.org 的使用狀況
- cy.wikipedia.org 的使用狀況
- el.wikipedia.org 的使用狀況
- en.wikipedia.org 的使用狀況
- es.wikipedia.org 的使用狀況
- eu.wikipedia.org 的使用狀況
- fr.wikipedia.org 的使用狀況
- hy.wikipedia.org 的使用狀況
- it.wikipedia.org 的使用狀況
- rw.wikipedia.org 的使用狀況
- www.wikidata.org 的使用狀況
- yo.wikipedia.org 的使用狀況
.png)