
File:Stirling's Approximation.svg

此 SVG 檔案的 PNG 預覽的大小:771 × 600 像素。 其他解析度:309 × 240 像素 | 617 × 480 像素 | 988 × 768 像素 | 1,280 × 996 像素 | 2,560 × 1,991 像素 | 2,700 × 2,100 像素。
原始檔案 (SVG 檔案,表面大小:2,700 × 2,100 像素,檔案大小:4 KB)
摘要
| 描述 |
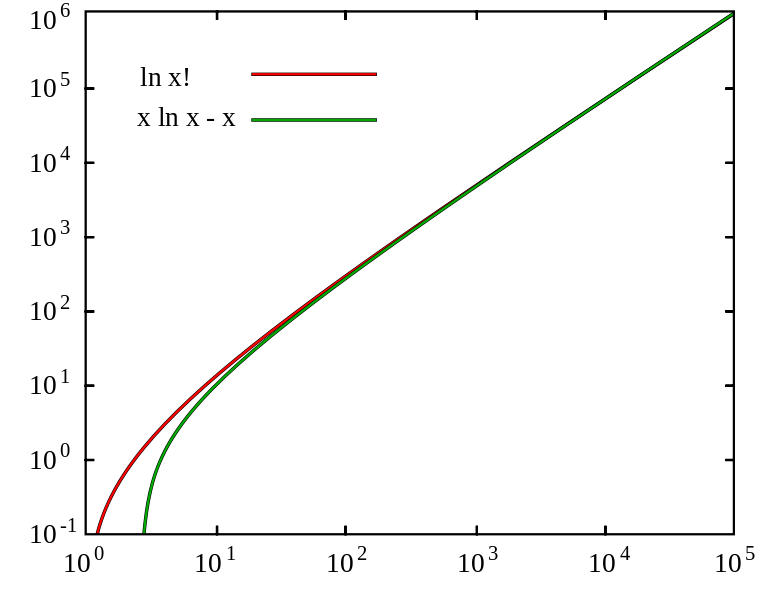
English: Stirling's approximation graph |
||
| 日期 | |||
| 來源 | Created by me | ||
| 作者 | R. A. Nonenmacher | ||
| 授權許可 (重用此檔案) |
我,本作品的著作權持有者,決定用以下授權條款發佈本作品:
This file is licensed under the Creative Commons Attribution-Share Alike Attribution-Share Alike 4.0 International, 3.0 Unported, 2.5 Generic, 2.0 Generic and 1.0 Generic license.
您可以選擇您需要的授權條款。 |

SVG code
<?xml version="1.0" encoding="utf-8"?>
<!DOCTYPE svg PUBLIC "-//W3C//DTD SVG 1.1//EN" "http://www.w3.org/Graphics/SVG/1.1/DTD/svg11.dtd">
<svg version = "1.1"
     id      = "Stirling_approximation_graph"
     xmlns   = "http://www.w3.org/2000/svg"
     width   = "2700"
     height  = "2100">
<!-- ==================== Data Curves ===================== -->
<g fill="none">
   <path stroke="#000" stroke-width="12" d="M  340,1871 C 440,1470, 960,1110,2567,  50"/>
   <path stroke="#00f" stroke-width="8"  d="M  340,1871 C 440,1470, 960,1110,2567,  50"/>
   <path stroke="#000" stroke-width="12" d="M 2571,  46 C 660,1310, 544,1445, 504,1870"/>
   <path stroke="#f00" stroke-width="8"  d="M 2571,  46 C 660,1310, 544,1445, 504,1870"/>
</g>
<!-- ==================== Legend ===================== -->
<text x="490" y="300" font-size="96">ln x!</text>
<text x="480" y="440" font-size="96">x ln x - x</text>
<polyline stroke="#000" stroke-width="12" points="880,260 1320,260"/>
<polyline stroke="#00f" stroke-width="8"  points="882,260 1318,260"/>
<polyline stroke="#000" stroke-width="12" points="880,420 1320,420"/>
<polyline stroke="#f00" stroke-width="8"  points="882,420 1318,420"/>
<!-- ==================== Y-Axis Labels ===================== -->
<text x="100" y=" 100" font-size="96">10</text> <text x="210" y="  60" font-size="72">6</text>
<text x="100" y=" 340" font-size="96">10</text> <text x="210" y=" 300" font-size="72">5</text>
<text x="100" y=" 600" font-size="96">10</text> <text x="210" y=" 560" font-size="72">4</text>
<text x="100" y=" 860" font-size="96">10</text> <text x="210" y=" 820" font-size="72">3</text>
<text x="100" y="1120" font-size="96">10</text> <text x="210" y="1080" font-size="72">2</text>
<text x="100" y="1380" font-size="96">10</text> <text x="210" y="1340" font-size="72">1</text>
<text x="100" y="1640" font-size="96">10</text> <text x="210" y="1600" font-size="72">0</text>
<text x="100" y="1900" font-size="96">10</text> <text x="210" y="1860" font-size="72">-1</text>
<!-- ==================== X-Axis Labels ===================== -->
<text x="220 " y="2000" font-size="96">10</text> <text x="330 " y="1960" font-size="72">0</text>
<text x="680 " y="2000" font-size="96">10</text> <text x="790 " y="1960" font-size="72">1</text>
<text x="1140" y="2000" font-size="96">10</text> <text x="1250" y="1960" font-size="72">2</text>
<text x="1600" y="2000" font-size="96">10</text> <text x="1710" y="1960" font-size="72">3</text>
<text x="2060" y="2000" font-size="96">10</text> <text x="2170" y="1960" font-size="72">4</text>
<text x="2500" y="2000" font-size="96">10</text> <text x="2610" y="1960" font-size="72">5</text>
<!-- ================= Axes & Tick Marks ================== -->
<polygon fill="none" stroke="#000" stroke-width="8" points="
    300,  40   300, 310   330, 310   300, 310   300, 570   330, 570   300, 570
               300, 830   330, 830   300, 830   300,1090   330,1090   300,1090
               300,1350   330,1350   300,1350   300,1610   330,1610   300,1610
    300,1870   760,1870   760,1840   760,1870  1210,1870  1210,1840  1210,1870
              1670,1870  1670,1840  1670,1870  2120,1870  2120,1840  2120,1870
   2570,1870  2570,1610  2540,1610  2570,1610  2570,1350  2540,1350  2570,1350
              2570,1090  2540,1090  2570,1090  2570, 830  2540, 830  2570, 830
              2570, 570  2540, 570  2570, 570  2570, 310  2540, 310  2570, 310
   2570,  40  2120,  40  2120,  70  2120,  40  1670,  40  1670,  70  1670,  40
              1210,  40  1210,  70  1210,  40   760,  40   760,  70   760,  40"/>
</svg>
W3C-validity not checked.
檔案歷史
點選日期/時間以檢視該時間的檔案版本。
| 日期/時間 | 縮圖 | 尺寸 | 使用者 | 備註 | |
|---|---|---|---|---|---|
| 目前 | 2011年10月19日 (三) 23:18 | | 2,700 × 2,100(4 KB) | Bender2k14 | fixed problem with display of the first two x-axis labels by moving the white space before the number values (instead of after) |
| 2008年8月19日 (二) 23:59 |  | 2,700 × 2,100(4 KB) | Nonenmac | == Summary == {{Information |Description={{en|1=Stirling's approximation graph}} |Source=Created by me |Author=R. A. Nonenmacher |Date=18-Aug-2008 |Permission={{self|GFDL|cc-by-sa-all}} |other_versions=[[:I |
檔案用途
下列頁面有用到此檔案:
全域檔案使用狀況
以下其他 wiki 使用了這個檔案:
- be.wikipedia.org 的使用狀況
- cs.wikipedia.org 的使用狀況
- el.wikipedia.org 的使用狀況
- fr.wikipedia.org 的使用狀況
- it.wikipedia.org 的使用狀況
- kk.wikipedia.org 的使用狀況
- ko.wikipedia.org 的使用狀況
- lt.wikipedia.org 的使用狀況
- mn.wikipedia.org 的使用狀況
- ro.wikipedia.org 的使用狀況
- ru.wikipedia.org 的使用狀況
- sk.wikipedia.org 的使用狀況
- uk.wikipedia.org 的使用狀況