跳至內容

File:Atmospheric Transmission.svg

頁面內容不支援其他語言。
這個檔案來自維基共享資源
維基百科,自由的百科全書

原始檔案 (SVG 檔案,表面大小:741 × 724 像素,檔案大小:321 KB)

顯示此圖片於


摘要

描述
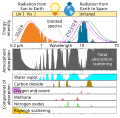
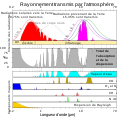
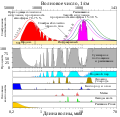
English: This figure shows the absorption bands in the Earth's atmosphere (middle panel) and the effect that this has on both solar radiation and upgoing thermal radiation (top panel). Individual absorption spectrum for major greenhouse gases plus Rayleigh scattering are shown in the lower panel.
日期
來源 This figure was prepared by Robert A. Rohde for the Global Warming Art project.
作者 Д.Ильин: vectorization (File:Atmospheric Transmission-ru.svg); Cepheiden translation back to english
其他版本

[編輯]

.svg:

.png:

 
向量圖形使用Inkscape創作v 。
Translate this file This SVG file contains embedded text that can be translated into your language, using any capable SVG editor, text editor or the SVG Translate tool. For more information see: About translating SVG files.


This figure shows the absorption bands in the Earth's atmosphere (middle panel) and the effect that this has on both solar radiation and upgoing thermal radiation (top panel). Individual absorption spectrum for major greenhouse gases plus Rayleigh scattering are shown in the lower panel.

Both the Earth and the Sun emit electromagnetic radiation (e.g. light) that closely follows a blackbody spectrum, and which can be predicted based solely on their respective temperatures. For the Sun, these emissions peak in the visible region and correspond to a temperature of ~5500 K. Emissions from the Earth vary following variations in temperature across different locations and altitudes, but always peak in the infrared.

The position and number of absorption bands are determined by the chemical properties of the gases present. In the present atmosphere, water vapor is the most significant of these greenhouse gases, followed by carbon dioxide and various other minor greenhouse gases. In addition, Rayleigh scattering, the physical process that makes the sky blue, also disperses some incoming sunlight. Collectively these processes capture and redistribute 25-30% of the energy in direct sunlight passing through the atmosphere. By contrast, the greenhouse gases capture 70-85% of the energy in upgoing thermal radiation emitted from the Earth surface.

Data sources and notes

The data used for these figures is based primarily on Spectral Calculator of GATS, Inc. archive copy at the Wayback Machine which implements the LINEPAK system of calculating absorption spectra (Gordley et al. 1994) from the HITRAN2004 (Rothman et al. 2004) spectroscopic database. To aid presentation, the absorption spectra were smoothed. Features with a bandwidth narrower than 0.5% of their wavelength may be obscured.

Calculations were done on the assumption of direct vertical transmission through an atmosphere with gas concentrations representative of modern day averages. In particular, absorption would be greater for radiation traveling obliquely through the atmosphere as it would encounter more gas.

The total scattering and absorption curve includes only the components indicated in the lower panel. These represent the vast majority of absorption contributing to the greenhouse effect and follow the treatment of Peixoto and Oort (1992), but other minor species such as carbon monoxide, nitric oxide and chloroflourocarbons (CFCs) have been omitted. Also omitted was scattering due to aerosols and other sources besides Rayleigh scattering.

The peaks in the blackbody spectra were adjusted to have the same height for ease in presentation.

授權條款

我,本作品的著作權持有者,決定用以下授權條款發佈本作品:
Creative Commons CC-Zero 此檔案在創用CC CC0 1.0 通用公有領域貢獻宣告之下分發。
在此宣告之下分發本作品者,已依據各國著作權法,在全世界放棄其對本作品所擁有的著作權及所有相關相似的法律權利,從而將本作品貢獻至公有領域。您可以複製、修改、分發和演示該作品,用於任何商業用途,所有這些都不需要請求授權。

References

  • Gordley, Larry L., Benjamin T. Marshall, Allen D. Chu (1994). "LINEPAK: Algorithms for modeling spectral transmittance and radiance". Journal of Quantitative Spectroscopy & Radiative Transfer 52 (5): 563-580.
  • L.S. Rothman, D. Jacquemart, A. Barbe, D. Chris Benner, M. Birk, L.R. Brown, M.R. Carleer, C. Chackerian Jr., K. Chance, L.H. Coudert, V. Dana, V.M. Devi, J.-M. Flaud, R.R. Gamache, A. Goldman, J.-M. Hartmann, K.W. Jucks, A.G. Maki, J.-Y. Mandin, S.T. Massie, J. Orphal, A. Perrin, C.P. Rinsland, M.A.H. Smith, J. Tennyson, R.N. Tolchenov, R.A. Toth, J. Vander Auwera, P. Varanasi, G. Wagner (2004). "The HITRAN 2004 molecular spectroscopic database". Journal of Quantitative Spectroscopy & Radiative Transfer 96: 139-204.
  • Peixoto, Jose P. and Abraham H. Oort (1992年) 《 Physics of Climate》、​Springer ISBN0883187124.

Other versions

[編輯]

.svg:

.png:

說明

添加單行說明來描述出檔案所代表的內容

在此檔案描寫的項目

描繪內容

著作權狀態 繁體中文 (已轉換拼寫)

多媒體型式 繁體中文 (已轉換拼寫)

image/svg+xml

校驗和 繁體中文 (已轉換拼寫)

130a81475d186ffb00ef185c7f981dd1fab93805

斷定方法:​SHA-1 中文 (已轉換拼寫)

328,865 位元組

724 像素

741 像素

檔案歷史

點選日期/時間以檢視該時間的檔案版本。

日期/時間縮⁠圖尺寸用戶備⁠註
目前2023年4月18日 (二) 16:19於 2023年4月18日 (二) 16:19 版本的縮圖741 × 724(321 KB)EfbrazilAdding white background color so renders correctly on smartphone
2022年8月7日 (日) 20:29於 2022年8月7日 (日) 20:29 版本的縮圖741 × 724(321 KB)Efbrazilcolor bug fix
2022年8月7日 (日) 20:00於 2022年8月7日 (日) 20:00 版本的縮圖741 × 724(321 KB)EfbrazilFixed translations as best as possible using text editor for new layout
2022年8月7日 (日) 19:34於 2022年8月7日 (日) 19:34 版本的縮圖741 × 724(320 KB)EfbrazilFixing text alignment
2022年8月7日 (日) 19:26於 2022年8月7日 (日) 19:26 版本的縮圖741 × 724(320 KB)EfbrazilGraphical improvements as per discussion page
2022年2月17日 (四) 17:59於 2022年2月17日 (四) 17:59 版本的縮圖741 × 724(208 KB)Pierre cbFile uploaded using svgtranslate tool (https://svgtranslate.toolforge.org/). Added translation for fr.
2021年3月18日 (四) 22:10於 2021年3月18日 (四) 22:10 版本的縮圖741 × 724(180 KB)Cepheidengerman labels adjusted
2021年3月18日 (四) 22:09於 2021年3月18日 (四) 22:09 版本的縮圖741 × 724(180 KB)Cepheidencorrection of labels
2021年3月18日 (四) 22:06於 2021年3月18日 (四) 22:06 版本的縮圖741 × 724(180 KB)CepheidenFile uploaded using svgtranslate tool (https://svgtranslate.toolforge.org/). Added translation for de.
2021年3月18日 (四) 21:52於 2021年3月18日 (四) 21:52 版本的縮圖741 × 724(154 KB)Cepheiden=={{int:filedesc}}== {{Information |description= {{en|1=This figure shows the absorption bands in the Earth's atmosphere (middle panel) and the effect that this has on both solar radiation and upgoing thermal radiation (top panel). Individual absorption spectrum for major greenhouse gases plus Rayleigh scattering are shown in the lower panel.}} |date=2021-03-18 |source=This figure was prepared by Robert A. Rohde for the Global Warming Art project. |author=[[User:Д.Ил...

下列頁面有用到此檔案:

全域檔案使用狀況

以下其他 wiki 使用了這個檔案:

詮釋資料