
File:Ineffective Price Floor.svg

此 SVG 檔案的 PNG 預覽的大小:400 × 400 像素。 其他解析度:240 × 240 像素 | 480 × 480 像素 | 768 × 768 像素 | 1,024 × 1,024 像素 | 2,048 × 2,048 像素。
原始檔案 (SVG 檔案,表面大小:400 × 400 像素,檔案大小:7 KB)
摘要
| 描述 |
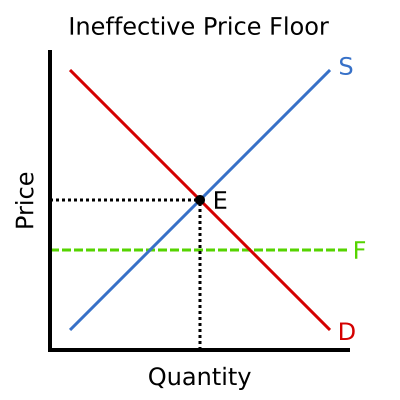
English: An illustrative supply/demand graph, showing an ineffective price floor (below equilibrium price). Line D (red) represents the demand (price vs. quantity demanded), line S (blue) represents the supply (price vs. quantity supplied), point E (black) is the equilibrium point, and line F (green, dashed) represents the price floor. |
||
| 日期 | |||
| 來源 | Own work, based on Image:Basic price floor.png | ||
| 作者 | Kbolino (talk) | ||
| 授權許可 (重用此檔案) |
|
原始上傳日誌
The original description page was here. All following user names refer to en.wikipedia.
- 2008-09-14 08:09 Kbolino 400×400× (7670 bytes) {{Information |Description=An illustrative supply/demand curve, showing an ineffective price floor (below equilibrium price). |Source=Own work, based on [[Image:Basic price floor.png]] |Date=14 September 2008 |Author=~~~ |other_versions= }}
檔案歷史
點選日期/時間以檢視該時間的檔案版本。
| 日期/時間 | 縮圖 | 尺寸 | 用戶 | 備註 | |
|---|---|---|---|---|---|
| 目前 | 2014年3月17日 (一) 09:48 | | 400 × 400(7 KB) | Wolfch | {{Information |Description=An illustrative supply/demand graph, showing an ineffective price floor (below equilibrium price). Line D (red) represents the demand (price vs. quantity demanded), line S (blue) represents the supply (price vs. quantity supp... |
檔案用途
下列頁面有用到此檔案:
全域檔案使用狀況
以下其他 wiki 使用了這個檔案:
- el.wikipedia.org 的使用狀況
- en.wikipedia.org 的使用狀況
- et.wikipedia.org 的使用狀況