File:Mandelbrot Creation Animation.gif

頁面內容不支援其他語言。
這個檔案來自維基共享資源
維基百科,自由的百科全書

Mandelbrot_Creation_Animation.gif(600 × 600 像素,檔案大小:1.78 MB,MIME 類型:image/gif、​循環、​20 畫格、​20秒)


摘要

描述

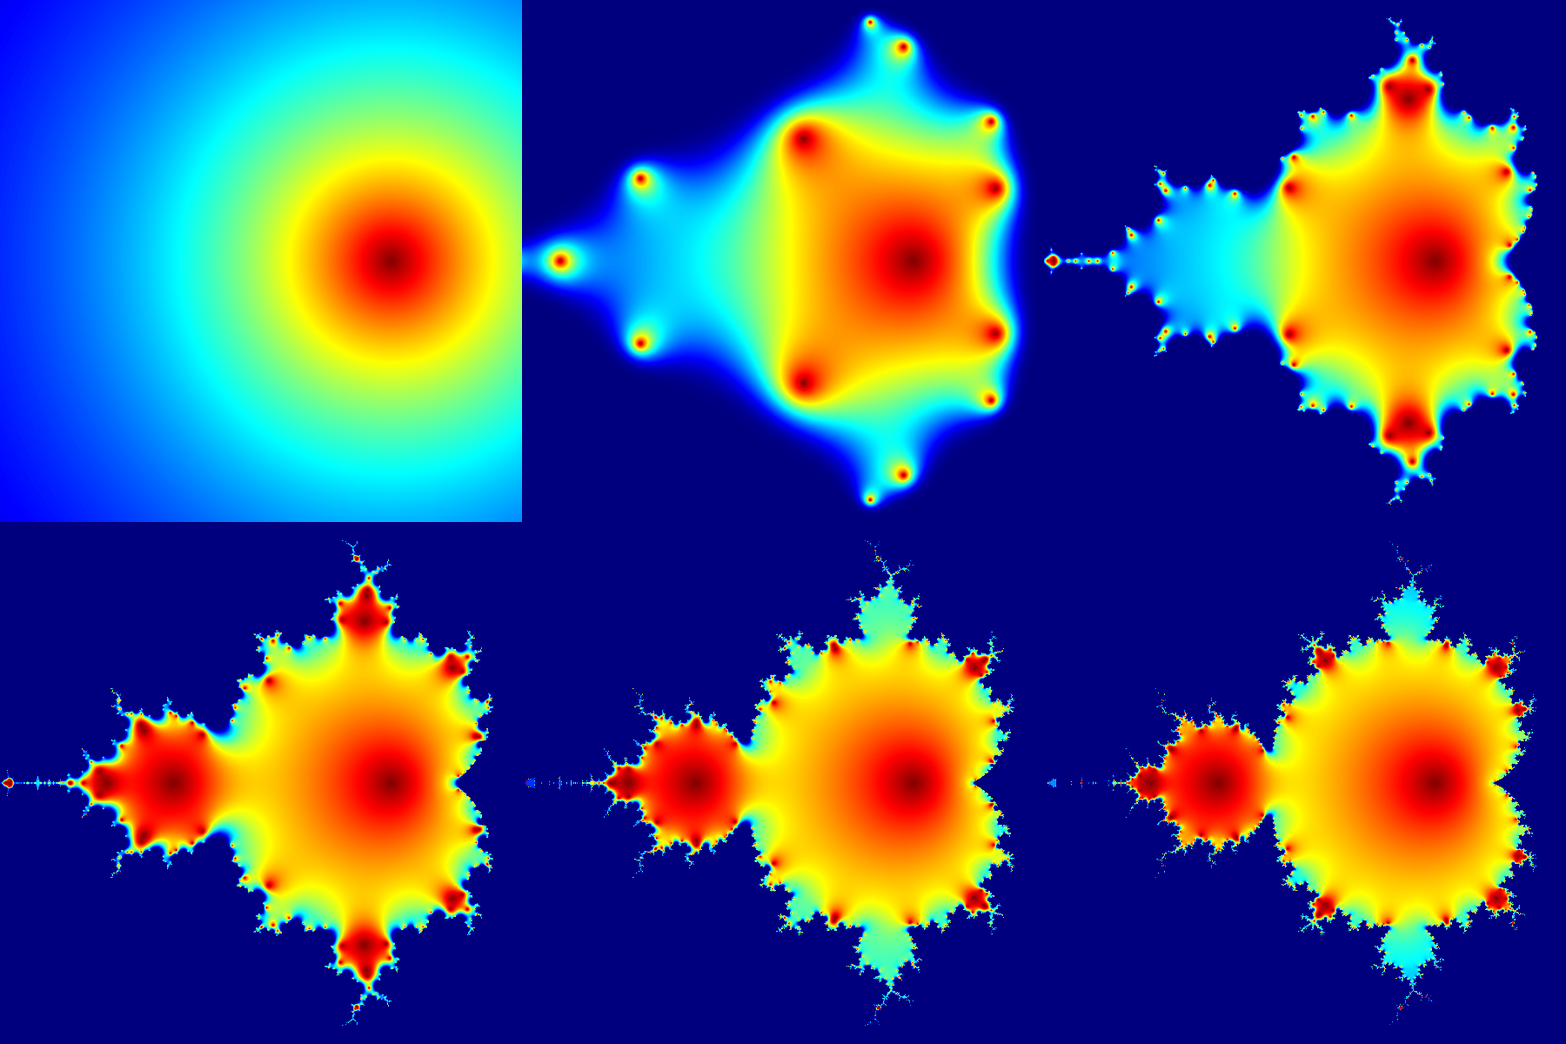
An animated diagram showing iterations of the equation used to generate the Mandelbrot set, a fractal first studied by Benoît Mandelbrot in 1979. The animation shows the values of Z for first 20 iterations of the equation

where c is a complex variable.

Mandelbrot set graphics are usually generated using the so-called "escape algorithm", where color is assigned according to the number of iterations it took for the equation to diverge past a pre-set limit, and black color is used for regions that never diverge. This, however, is a plot of a much simpler quantity: the actual values of the equation at the first 20 iterations. Every pixel in the image corresponds to a different value of a complex constant c ranging from -2.2 to 1 on the real axis (horizontal) and from -1.2i to 1.2i on the imaginary axis (vertical). Z is initialized to 0. At each iteration, the next value of Z is calculated using the equation above.

This graphic was generated with 13 lines of code in the R language (see below for the code). For each point, the magnitude (aka absolute value) of Z is calculated, than scaled using an exponential function to emphasize fine detail, and finally mapped to color palette (jetColors). Dark red is a very low number, dark blue is a very high number. The deep blue region "squeezing" in the boundaries of the fractal is the region where Z value diverges to infinity.
日期
來源 自己的作品
作者 Jarekt
其他版本 Mandelbrot Creation Animation (800x600).gif
GIF開發
InfoField
R logo 
本GIF 點陣圖使用R創作。
原始碼
InfoField

R code

library(caTools)
jet.colors = colorRampPalette(c("#00007F", "blue", "#007FFF", "cyan", "#7FFF7F", "yellow", "#FF7F00", "red", "#7F0000")) 
m = 600
C = complex( real=rep(seq(-1.8,0.6, length.out=m), each=m ), 
             imag=rep(seq(-1.2,1.2, length.out=m), m ) ) 
C = matrix(C,m,m)
Z = 0 
X = array(0, c(m,m,20))
for (k in 1:20) { 
  Z = Z^2+C 
  X[,,k] = exp(-abs(Z)) 
} 
write.gif(X, "Mandelbrot.gif", col=jet.colors, delay=100)

授權條款

Jarekt,此作品的版權所有人,決定用以下授權條款發佈本作品:
GNU head 已授權您依據自由軟體基金會發行的無固定段落、封面文字和封底文字GNU自由文件授權條款1.2版或任意後續版本,對本檔進行複製、傳播和/或修改。該協議的副本列在GNU自由文件授權條款中。
w:zh:共享創意
姓名標示 相同方式分享
This file is licensed under the Creative Commons Attribution-Share Alike Attribution-Share Alike 4.0 International, 3.0 Unported, 2.5 Generic, 2.0 Generic and 1.0 Generic license.
姓名標示: Jarekt
您可以自由:
  • 分享 – 複製、發佈和傳播本作品
  • 重新修改 – 創作演繹作品
惟需遵照下列條件:
  • 姓名標示 – 您必須指名出正確的製作者,和提供授權條款的連結,以及表示是否有對內容上做出變更。您可以用任何合理的方式來行動,但不得以任何方式表明授權條款是對您許可或是由您所使用。
  • 相同方式分享 – 如果您利用本素材進行再混合、轉換或創作,您必須基於如同原先的相同或兼容的條款,來分布您的貢獻成品。
您可以選擇您需要的授權條款。

說明

添加單行說明來描述出檔案所代表的內容

在此檔案描寫的項目

描繪內容

沒有維基數據項目的某些值

作者姓名字串 繁體中文 (已轉換拼寫):​Jarekt
維基媒體使用者名稱 繁體中文 (已轉換拼寫):​Jarekt

著作權狀態 繁體中文 (已轉換拼寫)

有著作權 繁體中文 (已轉換拼寫)

檔案來源 Chinese (Taiwan) (已轉換拼寫)

上傳者的原創作品 繁體中文 (已轉換拼寫)

多媒體型式 繁體中文 (已轉換拼寫)

image/gif

檔案歷史

點選日期/時間以檢視該時間的檔案版本。

日期/時間縮⁠圖尺寸用戶備⁠註
目前2007年6月13日 (三) 18:32於 2007年6月13日 (三) 18:32 版本的縮圖600 × 600(1.78 MB)Jarekt{{Information |Description=Animation GIF file showing iteration of creating Mandelbrot set image |Source=self-made |Date=06/13/2007 |Author= Jarekt }} Image generated using R language and executing the following code: library(caTools) jet

下列頁面有用到此檔案:

全域檔案使用狀況

以下其他 wiki 使用了這個檔案: