
File:Oil consumption per day by region from 1980 to 2006.svg

此 SVG 檔案的 PNG 預覽的大小:600 × 450 像素。 其他解析度:320 × 240 像素 | 640 × 480 像素 | 1,024 × 768 像素 | 1,280 × 960 像素 | 2,560 × 1,920 像素。
原始檔案 (SVG 檔案,表面大小:600 × 450 像素,檔案大小:204 KB)
| 描述 |
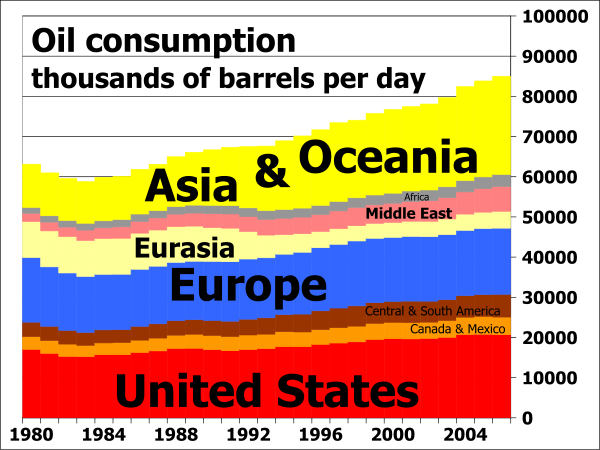
English: Oil consumption in daily barrels per region from 1980 to 2006; vertical extents indicate barrels of oil consumed per day, and the horizontal scale shows years from 1980 to 2007. |
| 日期 | |
| 來源 |
I, 84user, created this work using the excel file RecentPetroleumConsumptionBarrelsperDay.xls from the U.S. Energy Information Administration's web page http://tonto.eia.doe.gov/dnav/pet/pet_pri_wco_k_w.htm (direct link: http://www.eia.doe.gov/emeu/international/RecentPetroleumConsumptionBarrelsperDay.xls) and using Open Source Gnumeric 1.9.1 to produce the chart. See also  |
| 作者 | 84user |
| 授權許可 (重用此檔案) |
PD-SELF; Released into the public domain (by the author). |
| 其他版本 |
 |
See also


授權條款
| 此作品已由其作者,84user,釋出至公有領域。此授權條款在全世界均適用。 這可能在某些國家不合法,如果是的話: |
檔案歷史
點選日期/時間以檢視該時間的檔案版本。
| 日期/時間 | 縮圖 | 尺寸 | 用戶 | 備註 | |
|---|---|---|---|---|---|
| 目前 | 2008年10月25日 (六) 14:52 | | 600 × 450(204 KB) | 84user | increased main title font size |
| 2008年10月25日 (六) 14:31 |  | 600 × 450(195 KB) | 84user | {{Information |Description={{en|Oil consumption in daily barrels per region from 1980 to 2006; vertical extents indicate barrels of oil consumed per day, and the horizontal scale shows years from 1980 to 2007.}} |Source=I, 84user, created this work using |
檔案用途
沒有使用此檔案的頁面。
全域檔案使用狀況
以下其他 wiki 使用了這個檔案:
- en.wikipedia.org 的使用狀況
- es.wikipedia.org 的使用狀況
- fa.wikipedia.org 的使用狀況
- id.wikipedia.org 的使用狀況
- ko.wikipedia.org 的使用狀況
- th.wikipedia.org 的使用狀況
- ur.wikipedia.org 的使用狀況