File:Podaac blob colordata sst2015.jpg

頁面內容不支援其他語言。
這個檔案來自維基共享資源
維基百科,自由的百科全書

原始檔案(900 × 1,066 像素,檔案大小:267 KB,MIME 類型:image/jpeg


摘要

描述
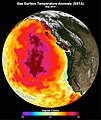
English: "This data image shows the monthly average sea surface temperature for May 2015. Between 2013 and 2016, a large mass of unusually warm ocean water--nicknamed the blob--dominated the North Pacific, indicated here by red, pink, and yellow colors signifying temperatures as much as three degrees Celsius (five degrees Fahrenheit) higher than average. Data are from the NASA Multi-scale Ultra-high Resolution Sea Surface Temperature (MUR SST) Analysis product." (Laura Naranjo "The Blob", NASA, March 15th 2019)
Deutsch: Durchschnittstemperaturen der Meeresoberfläche im Mai 2015 im Nordostpazifik, während der marinen Hitzewelle "The Blob" (2013–2016). Die Temperaturen liegen bis zu drei Grad höher als gewöhnlich.
日期
來源 Laura Naranjo "The Blob", NASA, March 15th 2019, https://earthdata.nasa.gov/user-resources/sensing-our-planet/blob
作者 NASA Physical Oceanography Distributed Active Archive Center

授權條款

Public domain 本作品由NASA創作,屬於公有領域。根據NASA的版權政策:“NASA的創作除非另有聲明否則不受版權保護。”(參見:Template:PD-USGov/zhNASA版權政策JPL圖像使用政策
警告:

說明

添加單行說明來描述出檔案所代表的內容
Sea surface temperatures of the North-Eastern Pacific of May 2015, during the marine heatwave known as "The Blob"

在此檔案描寫的項目

描繪內容

檔案歷史

點選日期/時間以檢視該時間的檔案版本。

日期/時間縮⁠圖尺寸用戶備⁠註
目前2019年3月29日 (五) 23:01於 2019年3月29日 (五) 23:01 版本的縮圖900 × 1,066(267 KB)DeWikiMan{{Information |description ={{en|1="This data image shows the monthly average sea surface temperature for May 2015. Between 2013 and 2016, a large mass of unusually warm ocean water--nicknamed the blob--dominated the North Pacific, indicated here by red, pink, and yellow colors signifying temperatures as much as three degrees Celsius (five degrees Fahrenheit) higher than average. Data are from the NASA Multi-scale Ultra-high Resolution Sea Surface Temperature (MUR SST) Analysis product." (L...

下列頁面有用到此檔案:

全域檔案使用狀況

以下其他 wiki 使用了這個檔案: