
File:Polar Bear Habitat.png

預覽大小:669 × 599 像素。 其他解析度:268 × 240 像素 | 536 × 480 像素 | 981 × 879 像素。
原始檔案 (981 × 879 像素,檔案大小:605 KB,MIME 類型:image/png)
摘要
| 描述 |
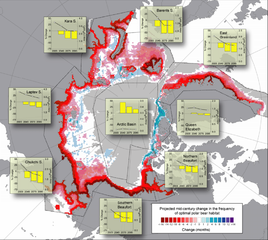
Projected changes (based on 10 IPCC AR-4 GCM models run with the SRES- A1B forcing scenario) in the spatial distribution and integrated annual area of optimal polar bear habitat. Base map shows the cumulative number of months per decade where optimal polar bear habitat was either lost (red) or gained (blue) from 2001–2010 to 2041–2050. Offshore gray shading denotes areas where optimal habitat was absent in both periods. Insets show the average annual ( 12 months) cumulative area of optimal habitat (right y-axis, line plot) for four 10-year periods in the 21st century (x-axis midpoints), and their associated percent change in area (left y axis, histograms) relative to the first decade (2001–2010). |
| 來源 | Predicting The Future Distribution of Polar Bear Habitat in the Polar Basin from Resource Selection Functions Applied to 21st Century General Circulation Model Projections of Sea Ice |
| 作者 | USGS |
授權條款
此作品在美國屬於公有領域,因為其是由美國政府的官員或僱員,基於其個人公務目的製作的作品,參考美國法典第17篇第1章第105條。
注意︰本模板僅適用於美國聯邦政府的原創作品,不適用於任何美國州、屬地、聯邦個體、縣、市或任何次級政府的作品。本模板也不適用於1978年以後由美國郵政署出版的郵票圖案(參看美國版權局實踐綱領第313.6(C)(1)條)。也不適用於部分美國硬幣;參看美國鑄幣局使用條款。 |
 | |
| 此作品無已知的著作權限制,亦不受所有相關和鄰接的權利限制。 | ||
檔案歷史
點選日期/時間以檢視該時間的檔案版本。
| 日期/時間 | 縮圖 | 尺寸 | 用戶 | 備註 | |
|---|---|---|---|---|---|
| 目前 | 2010年11月24日 (三) 16:54 | | 981 × 879(605 KB) | PawełS | Bigger resolution. Screenshot of PDF in bigger zoom. |
| 2007年11月30日 (五) 22:46 |  | 610 × 546(423 KB) | Sagredo | {{Information |Description=Projected changes (based on 10 IPCC AR-4 GCM models run with the SRES- A1B forcing scenario) in the spatial distribution and integrated annual area of optimal polar bear habitat. Base map shows the cumulative number of months |
檔案用途
下列頁面有用到此檔案:
全域檔案使用狀況
以下其他 wiki 使用了這個檔案:
- ar.wikipedia.org 的使用狀況
- ca.wikipedia.org 的使用狀況
- cs.wikipedia.org 的使用狀況
- de.wikipedia.org 的使用狀況
- en.wikipedia.org 的使用狀況
- eo.wikipedia.org 的使用狀況
- es.wikipedia.org 的使用狀況
- fr.wikipedia.org 的使用狀況
- gl.wikipedia.org 的使用狀況
- gu.wikipedia.org 的使用狀況
- hi.wikipedia.org 的使用狀況
- kn.wikipedia.org 的使用狀況
- pt.wikipedia.org 的使用狀況
- si.wikipedia.org 的使用狀況
- vi.wikipedia.org 的使用狀況