File:Usage share of alternative web browsers (Source StatCounter).svg

頁面內容不支援其他語言。
這個檔案來自維基共享資源
維基百科,自由的百科全書

原始檔案(SVG 檔案,表面大小:630 × 630 像素,檔案大小:43 KB)


摘要

描述
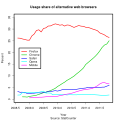
English: The graph was generated with the below R code (file name "generate.R"):
# Running:
#> setwd("[path]")
#> source("generate.R")
browser.data <- read.table("stats.txt", header=T, sep="\t")
browser.names = c("Firefox", "Chrome", "Safari", "Opera", "mobile")
browser.years = as.Date(browser.data$Date)

# http://gs.statcounter.com/#browser-ww-monthly-201109-201301
browser.firefox = browser.data$Firefox
browser.chrome = browser.data$Chrome
browser.safari = browser.data$Safari
browser.opera = browser.data$Opera
# http://gs.statcounter.com/#mobile_vs_desktop-ww-monthly-201109-201301
browser.mobile = browser.data$Mobile

browser.title = "Usage share of alternative web browsers"
browser.sub = "Source: StatCounter - Browser and Mobile vs Desktop (both monthly)"
browser.file = "Usage share of alternative web browsers (Source StatCounter).svg"


browser.maxPercent = max(browser.firefox, browser.chrome, browser.safari, browser.opera, na.rm=TRUE)
browser.maxPercent = ceiling(browser.maxPercent/10)*10

# output
svg(file=browser.file)

# lwd - thicknes of plot lines
# mar - margin in lines: bottom, left, top, right
par(lwd=3,mar=c(2,2,0,0))

# plot with title and subtitle (change mar above!)
#plot(browser.years, browser.firefox, col=2, type="l", ylim=c(0, browser.maxPercent), xlab="Year", ylab="Percent", main=browser.title, sub=browser.sub)
plot(browser.years, browser.firefox, col=2, type="l", ylim=c(0, browser.maxPercent), xlab="Year", ylab="Percent")
lines(browser.years, browser.chrome, col=3)
lines(browser.years, browser.safari, col=4)
lines(browser.years, browser.opera, col=5)
# mobile is from different source - adding different style
lines(browser.years, browser.mobile, col=6, lty=3)
 
# legend in the plot area
legend("left",inset=0.05,col=2:6,lwd=3,legend=browser.names)
 
dev.off()

Contents of stat.txt (NA = not available):

Date	Firefox	Chrome	Safari	Opera	Other	Mobile
2013-02-01	21.32	37.05	8.56	1.22	1.92	14.3
2013-01-01	21.42	36.52	8.29	1.19	1.87	14.13
2012-12-01	21.89	36.42	7.92	1.26	1.72	14.55
2012-11-01	22.37	35.72	7.83	1.39	1.46	13.08
2012-10-01	22.32	34.77	7.81	1.63	1.39	12.3
2012-09-01	22.4	34.21	7.7	1.61	1.38	12.03
2012-08-01	22.85	33.59	7.39	1.63	1.69	11.78
2012-07-01	23.73	33.81	7.12	1.72	1.58	11.09
2012-06-01	24.56	32.76	7	1.77	1.61	10.4
2012-05-01	25.55	32.43	7.09	1.77	1.04	10.11
2012-04-01	24.87	31.23	7.13	1.72	0.98	9.58
2012-03-01	24.98	30.87	6.72	1.78	0.82	8.99
2012-02-01	24.88	29.84	6.77	2.02	0.73	8.53
2012-01-01	24.78	28.4	6.62	1.95	0.79	8.49
2011-12-01	25.27	27.27	6.08	1.98	0.75	8.04
2011-11-01	25.23	25.69	5.92	1.82	0.71	6.95
2011-10-01	26.39	25	5.93	1.81	0.69	6.55
2011-09-01	26.79	23.61	5.6	1.72	0.62	6.74
2011-08-01	27.49	23.16	5.19	1.67	0.61	7.12
2011-07-01	27.95	22.14	5.17	1.66	0.63	7.02
2011-06-01	28.34	20.65	5.07	1.74	0.61	6.53
2011-05-01	29.29	19.36	5.01	1.84	0.63	5.75
2011-04-01	29.67	18.29	5.04	1.91	0.57	5.21
2011-03-01	29.98	17.37	5.02	1.97	0.54	4.7
2011-02-01	30.37	16.54	5.08	2	0.55	4.45
2011-01-01	30.68	15.68	5.09	2	0.55	4.3
2010-12-01	30.76	14.85	4.79	2.07	0.58	4.1
2010-11-01	31.17	13.35	4.7	2.01	0.6	4.02
2010-10-01	31.24	12.39	4.56	2	0.6	3.81
2010-09-01	31.5	11.54	4.42	2.03	0.63	3.5
2010-08-01	31.09	10.76	4.23	1.88	0.7	3.21
2010-07-01	30.69	9.88	4.09	1.91	0.74	2.86
2010-06-01	31.15	9.24	4.07	1.91	0.77	2.57
2010-05-01	31.64	8.61	4.14	1.96	0.88	2.32
2010-04-01	31.74	8.06	4.23	1.82	0.89	2.18
2010-03-01	31.27	7.29	4.16	1.97	0.87	1.96
2010-02-01	31.82	6.72	4.08	1.97	0.91	1.72
2010-01-01	31.64	6.04	3.76	2	1.31	1.56
2009-12-01	31.97	5.45	3.48	2.06	1.31	1.28
2009-11-01	32.21	4.66	3.67	2.02	0.86	1.21
2009-10-01	31.82	4.17	3.47	1.88	0.7	1.15
2009-09-01	31.34	3.69	3.28	2.62	0.7	1.12
2009-08-01	31.28	3.38	3.25	2.67	0.73	1.12
2009-07-01	30.5	3.01	3.02	2.64	0.72	1.05
2009-06-01	30.33	2.82	2.93	3.36	1.07	0.94
2009-05-01	28.75	2.42	2.65	3.23	0.87	0.86
2009-04-01	29.67	2.07	2.75	2.96	0.68	0.86
2009-03-01	29.4	1.73	2.73	2.94	0.68	0.8
2009-02-01	27.85	1.52	2.59	2.95	0.67	0.69
2009-01-01	27.03	1.38	2.57	2.92	0.7	0.67
2008-12-01	25.23	1.21	2.41	2.83	0.48	0.6
2008-11-01	25.27	0.93	2.49	3.01	0.16	NA
2008-10-01	25.54	1.02	2.91	2.69	0.17	NA
2008-09-01	25.77	1.03	3	2.86	0.18	NA
2008-08-01	26.08	NA	2.99	1.83	0.2	NA
2008-07-01	26.14	NA	3.3	1.78	0.21	NA
Note that StatCounter doesn't clearly state how does it calculate monthly stats.
日期
來源 自己的作品, data from StatCounter Browser (monthly) and Mobile vs Desktop (monthly)
作者 Daniel.Cardenas, Maciej "Nux" Jaros

授權條款

我,本作品的著作權持有者,決定用以下授權條款發佈本作品:
w:zh:共享創意
姓名標示
此檔案採用創用CC 姓名標示 3.0 未在地化版本授權條款。
您可以自由:
  • 分享 – 複製、發佈和傳播本作品
  • 重新修改 – 創作演繹作品
惟需遵照下列條件:
  • 姓名標示 – 您必須指名出正確的製作者,和提供授權條款的連結,以及表示是否有對內容上做出變更。您可以用任何合理的方式來行動,但不得以任何方式表明授權條款是對您許可或是由您所使用。

說明

添加單行說明來描述出檔案所代表的內容

在此檔案描寫的項目

描繪內容

著作權狀態 繁體中文 (已轉換拼寫)

有著作權 繁體中文 (已轉換拼寫)

檔案來源 Chinese (Taiwan) (已轉換拼寫)

上傳者的原創作品 繁體中文 (已轉換拼寫)

檔案歷史

點選日期/時間以檢視該時間的檔案版本。

日期/時間縮⁠圖尺寸用戶備⁠註
目前2013年2月23日 (六) 15:31於 2013年2月23日 (六) 15:31 版本的縮圖630 × 630(43 KB)Nux{{Information |Description ={{en|1=-}} |Source =- |Author =- |Date = |Permission = |other_versions = }} clear indication of mobile being different
2013年2月23日 (六) 15:21於 2013年2月23日 (六) 15:21 版本的縮圖630 × 630(43 KB)Nux{{Information |Description ={{en|1=-}} |Source =- |Author =- |Date = |Permission = |other_versions = }} no titles
2013年2月23日 (六) 13:46於 2013年2月23日 (六) 13:46 版本的縮圖630 × 630(86 KB)Nux{{Information |Description ={{en|1=212}} {{pl|1=121}} |Source =StatCounter - stats named "Browser" and "Mobile vs Desktop" (both monthly) |Author =1212 |Date = |Permission = |other_versions = }}
2011年11月12日 (六) 06:11於 2011年11月12日 (六) 06:11 版本的縮圖630 × 630(55 KB)Daniel.CardenasAdd Sept and Oct
2011年9月3日 (六) 23:31於 2011年9月3日 (六) 23:31 版本的縮圖630 × 630(55 KB)Daniel.CardenasAdd July and August
2011年7月17日 (日) 21:18於 2011年7月17日 (日) 21:18 版本的縮圖630 × 630(55 KB)Daniel.Cardenas

沒有使用此檔案的頁面。

全域檔案使用狀況

以下其他 wiki 使用了這個檔案:

詮釋資料