
File:20201211 Billion dollar events related to climate change - U.S. -en.svg

原始檔案 (SVG 檔案,表面大小:1,200 × 675 像素,檔案大小:4 KB)
摘要
| 描述 |
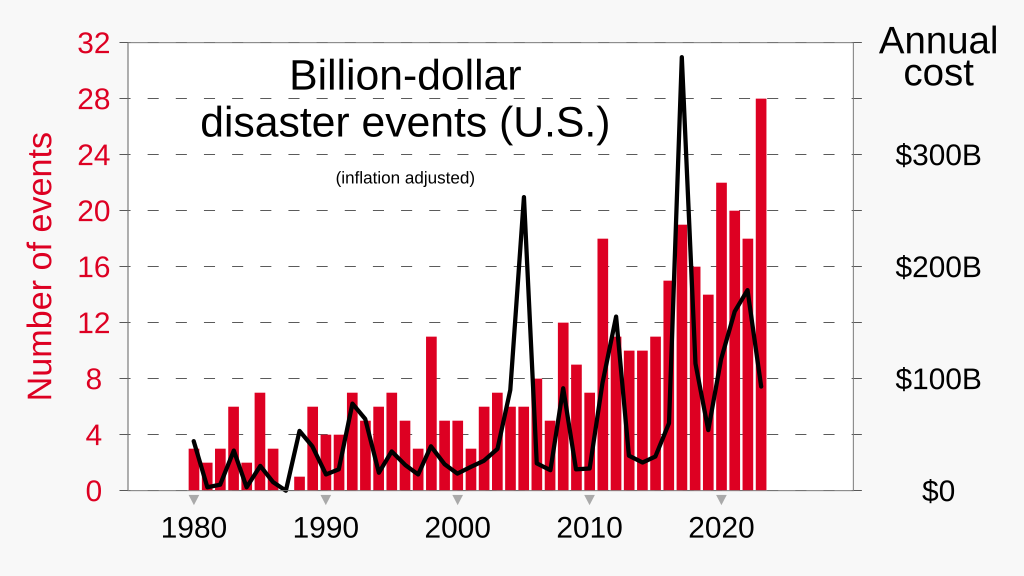
English: Graph of number billion-dollar climate-related events in the United States, and annual costs of those events, based on NOAA's National Centers for Environmental Information.
|
| 日期 | |
| 來源 | 自己的作品 |
| 作者 | RCraig09 |
.png)
Source data
Data through 2023:
| Click at right to show/hide data |
|---|
|
Year — Disasters Count — Cost
|
授權條款
- 您可以自由:
- 分享 – 複製、發佈和傳播本作品
- 重新修改 – 創作演繹作品
- 惟需遵照下列條件:
- 姓名標示 – 您必須指名出正確的製作者,和提供授權條款的連結,以及表示是否有對內容上做出變更。您可以用任何合理的方式來行動,但不得以任何方式表明授權條款是對您許可或是由您所使用。
- 相同方式分享 – 如果您利用本素材進行再混合、轉換或創作,您必須基於如同原先的相同或兼容的條款,來分布您的貢獻成品。
檔案歷史
點選日期/時間以檢視該時間的檔案版本。
| 日期/時間 | 縮圖 | 尺寸 | 用戶 | 備註 | |
|---|---|---|---|---|---|
| 目前 | 2024年1月13日 (六) 04:54 | | 1,200 × 675(4 KB) | RCraig09 | Version 9: revise to include data newly changed on NOAA website (25 ---> 28 events . . . . and $81.0B ---> $92.9B) |
| 2024年1月1日 (一) 21:13 |  | 1,200 × 675(4 KB) | RCraig09 | Version 8: update to include 2023 data | |
| 2023年1月15日 (日) 17:09 |  | 1,200 × 675(4 KB) | RCraig09 | Version 7: change shade of red (avoiding the "primary color" tendency that's apparently falling into disfavor) | |
| 2022年12月31日 (六) 05:50 |  | 1,200 × 675(4 KB) | RCraig09 | Version 6: update to include data for 2022 | |
| 2022年1月12日 (三) 22:53 |  | 1,200 × 675(4 KB) | RCraig09 | Version 5: change scale on right, so red and black traces occupy about the same vertical space | |
| 2022年1月12日 (三) 06:31 |  | 1,200 × 675(5 KB) | RCraig09 | Version 4: update to include 2021 data . . . changing width/height ratio | |
| 2021年2月22日 (一) 18:08 |  | 1,000 × 630(43 KB) | RCraig09 | Version 3: changed background shading so graph area is white and border is opaque light-gray | |
| 2021年1月8日 (五) 20:27 |  | 1,000 × 630(42 KB) | RCraig09 | Version 2: updating to include data through ENTIRE YEAR 2020 (not just through the Sept 2020 data that was in Version 1). | |
| 2020年12月12日 (六) 06:26 |  | 1,000 × 630(41 KB) | RCraig09 | Uploaded own work with UploadWizard |
檔案用途
下列頁面有用到此檔案:
全域檔案使用狀況
以下其他 wiki 使用了這個檔案:
- en.wikipedia.org 的使用狀況
- ga.wikipedia.org 的使用狀況