
File:Long-term-change-in-land-use.png
原始檔案 (3,214 × 2,900 像素,檔案大小:501 KB,MIME 類型:image/png)
摘要
| 描述 |
English: Many people think of environmental concerns as a modern issue: humanity’s destruction of nature and ecosystems as a result of very recent population growth and increasing consumption. This is true for some problems, such as climate change. But it’s not the case for deforestation. Humans have been cutting down trees for millennia.
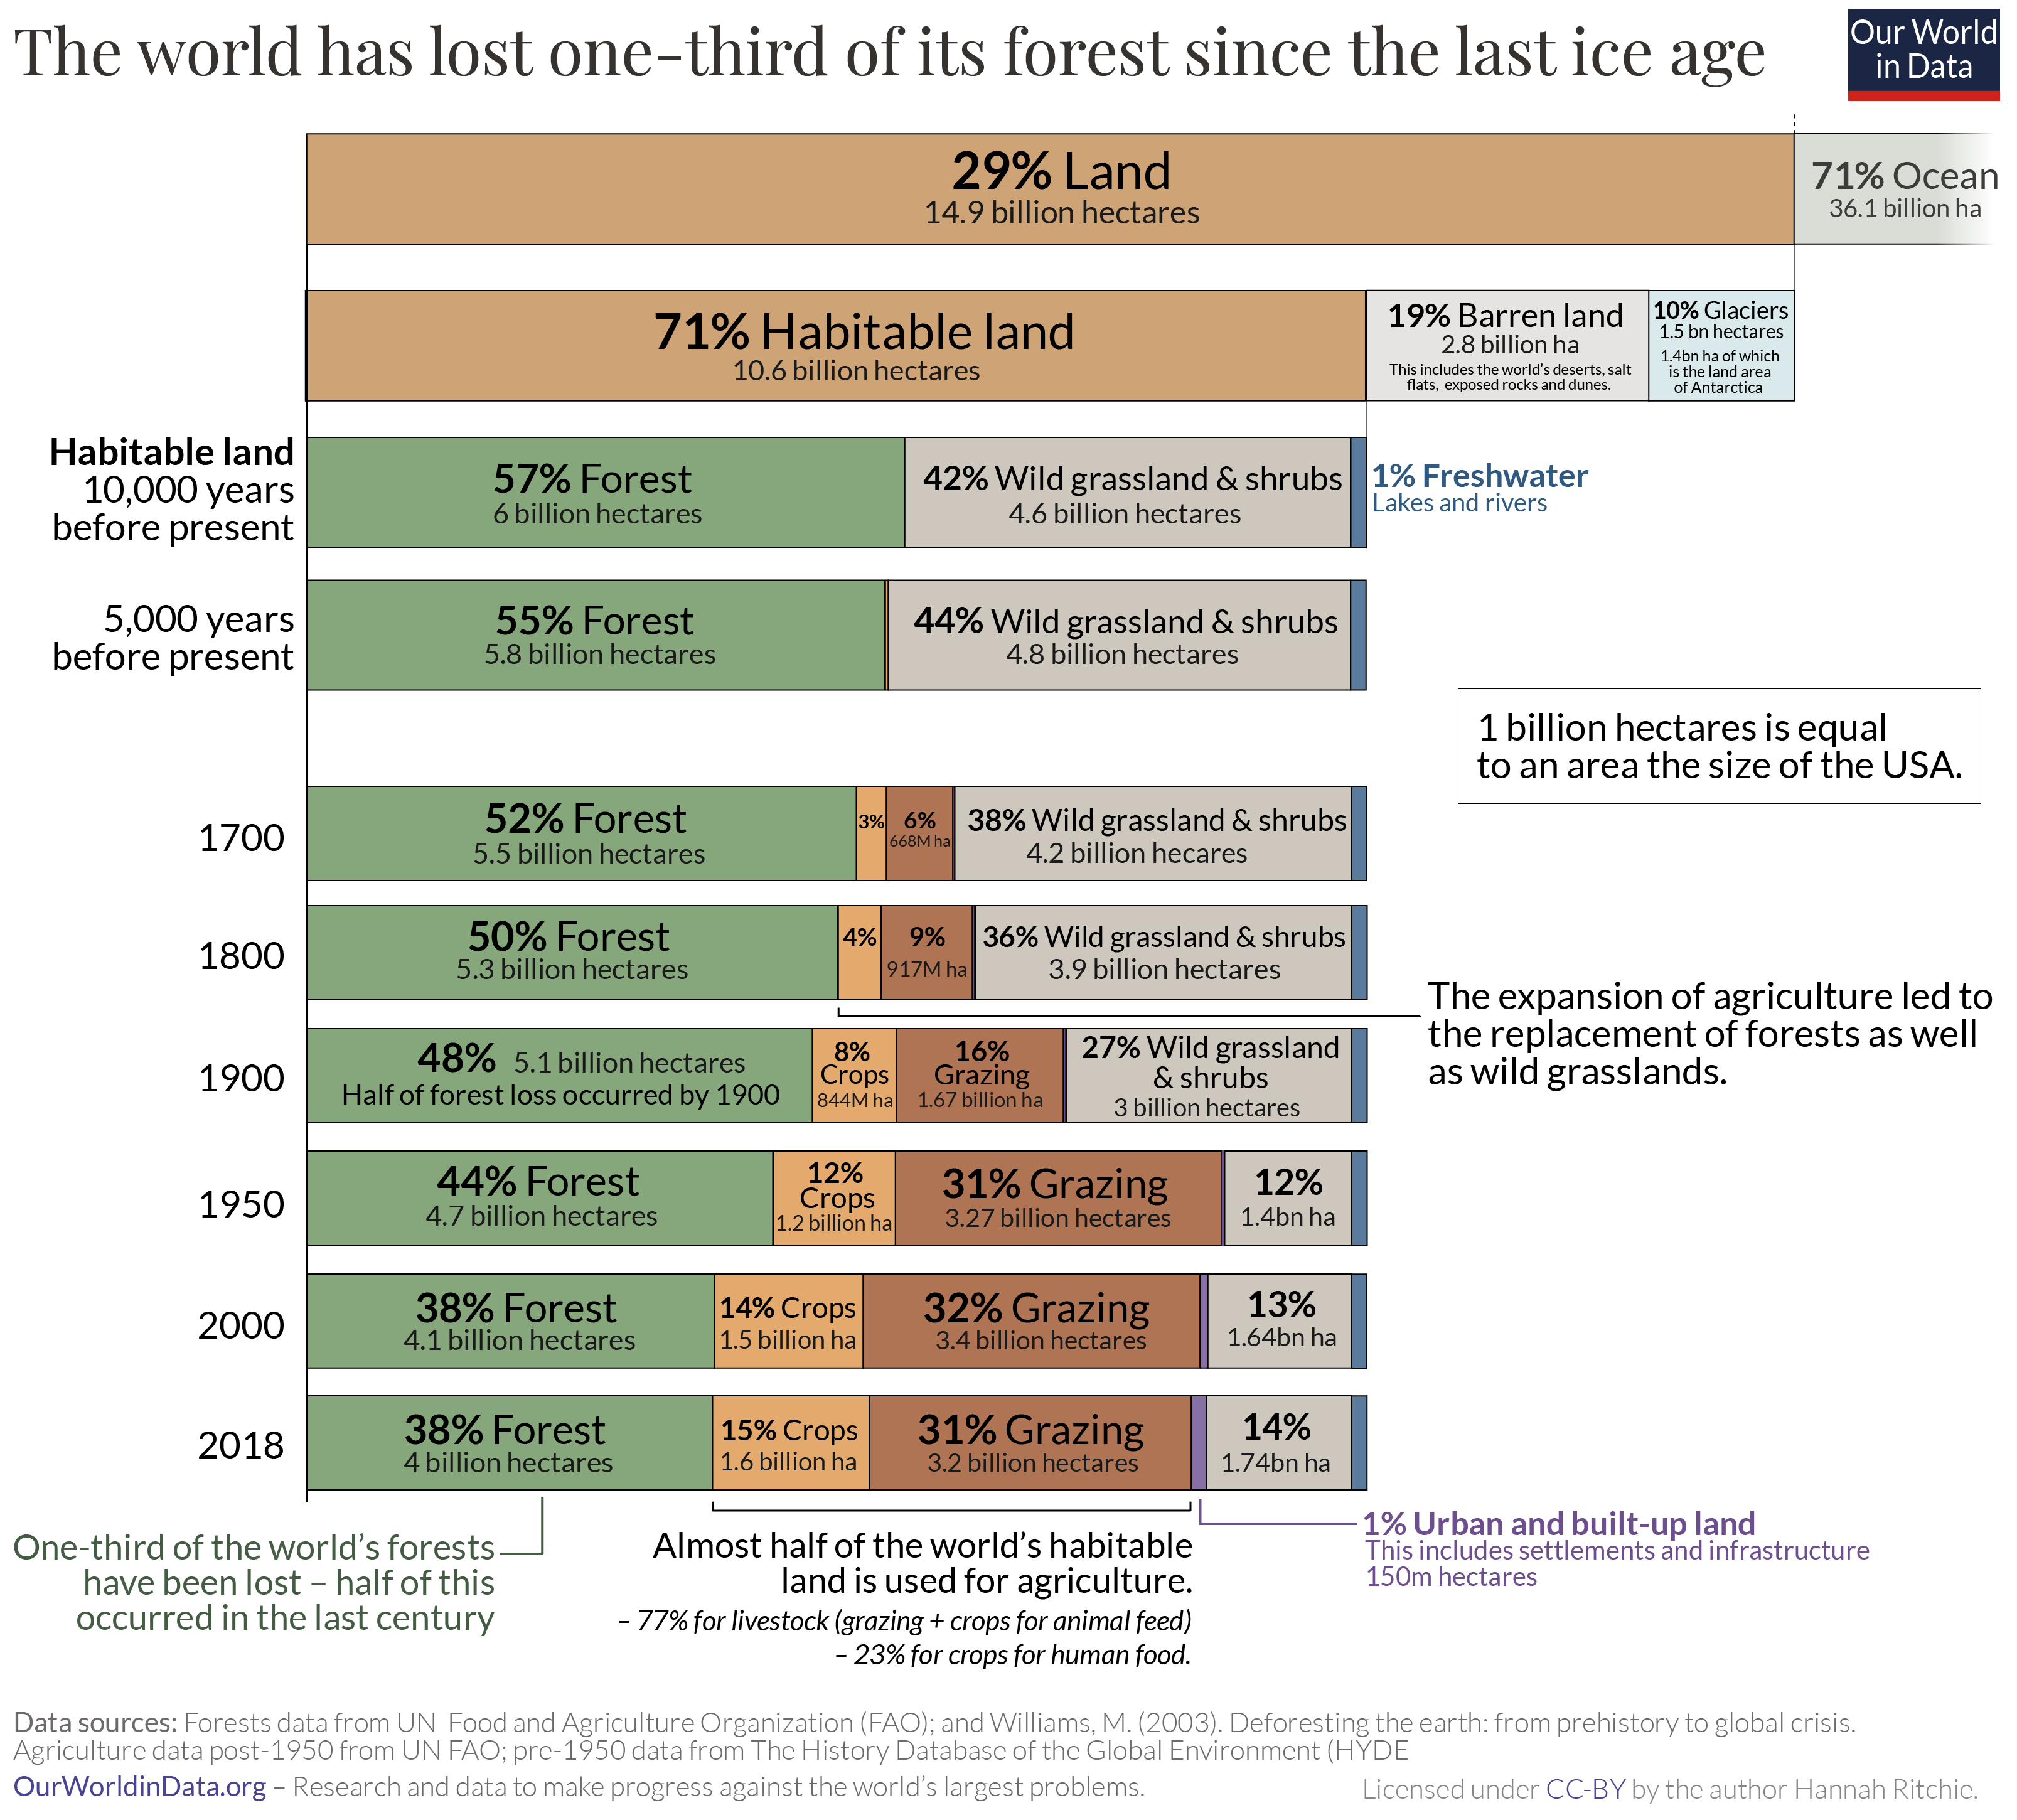
How much forest has the world lost? When in history did we lose it? In the chart we see how the cover of the earth’s surface has changed over the past 10,000 years. This is shortly after the end of the last great ice age, through to the present day.2 Let’s start at the top. You see that of the 14.9 billion hectares of land on the planet, only 71% of it is habitable – the other 29% is either covered by ice and glaciers, or is barren land such as deserts, salt flats, or dunes. I have therefore excluded these categories so we can focus on how habitable land is used. The bar chart just below shows the earth’s surface cover just after the end of the last ice age.3 10,000 years ago 57% of the world’s habitable land was covered by forest. That’s 6 billion hectares. Today, only 4 billion hectares are left. The world has lost one-third of its forest – an area twice the size of the United States. Only 10% of this was lost in the first half of this period, until 5,000 years ago. The global population at this time was small and growing very slowly – there were fewer than 50 million people in the world. The amount of land per person that was needed to produce enough food was not small – in fact, it was much larger than today. But a small global population overall meant there was little pressure on forests to make space for land to grow food, and as wood for energy. If we fast-forward to 1700 when the global population had increased more than ten-fold, to 603 million. The amount of land used for agriculture – land to grow crops as well as grazing land for livestock – was expanding. You will notice in the chart that this was not only expanding into previously forested land, but also other land uses such as wild grasslands and shrubbery. Still, more than half of the world’s habitable land was forested. The turn of the 20th century is when global forest loss reached the halfway point: half of total forest loss occurred from 8,000BC to 1900; the other half occurred in the last century alone. This emphasises two important points. First, it reiterates that deforestation is not a new problem: relatively small populations of the past were capable of driving a large amount of forest loss. By 1900, there were 1.65 billion people in the world (five times fewer than we have today) but for most of the previous period, humans were deforesting the world with only tens or hundreds of millions. Even with the most basic of lifestyles compared to today’s standards, the per capita footprint of our ancestors would have been large. Low agricultural productivity and a reliance on wood for fuel meant that large amounts of land had to be cleared for basic provisions. Second, it makes clear how much deforestation accelerated over the last century. In just over 100 years the world lost as much forest as it had in the previous 9,000 years. An area the size of the United States. From the chart we see that this was driven by the continued expansion of land for agriculture. By 1950, there was almost as much agricultural land as forest – 43% of habitable land. By 2018, this had increased to 46% while forests shrank to 38%. When we think of the growing pressures on land from modern populations we often picture sprawling megacities. But urban land accounts for just 1% of global habitable land. Humanity’s biggest footprint is due to what we eat, not where we live. |
| 日期 | |
| 來源 | https://ourworldindata.org/deforestation |
| 作者 | Hannah Ritchie and Max Roser |
Related file
-
 8000 BCE+ Loss of forest and grassland to grazing and crops.svg — Charts most of same data, but focuses on habitable land

授權條款
- 您可以自由:
- 分享 – 複製、發佈和傳播本作品
- 重新修改 – 創作演繹作品
- 惟需遵照下列條件:
- 姓名標示 – 您必須指名出正確的製作者,和提供授權條款的連結,以及表示是否有對內容上做出變更。您可以用任何合理的方式來行動,但不得以任何方式表明授權條款是對您許可或是由您所使用。
檔案歷史
點選日期/時間以檢視該時間的檔案版本。
| 日期/時間 | 縮圖 | 尺寸 | 使用者 | 備註 | |
|---|---|---|---|---|---|
| 目前 | 2021年12月14日 (二) 15:47 | | 3,214 × 2,900(501 KB) | PJ Geest | Uploaded a work by Hannah Ritchie and Max Roser from https://ourworldindata.org/deforestation with UploadWizard |
檔案用途
沒有使用此檔案的頁面。