
File:US2009FederalExpenditures.png
預覽大小:600 × 599 像素。 其他解析度:240 × 240 像素 | 481 × 480 像素 | 769 × 768 像素 | 1,025 × 1,024 像素 | 2,099 × 2,096 像素。
原始檔案 (2,099 × 2,096 像素,檔案大小:107 KB,MIME 類型:image/png)
摘要
| 描述 |
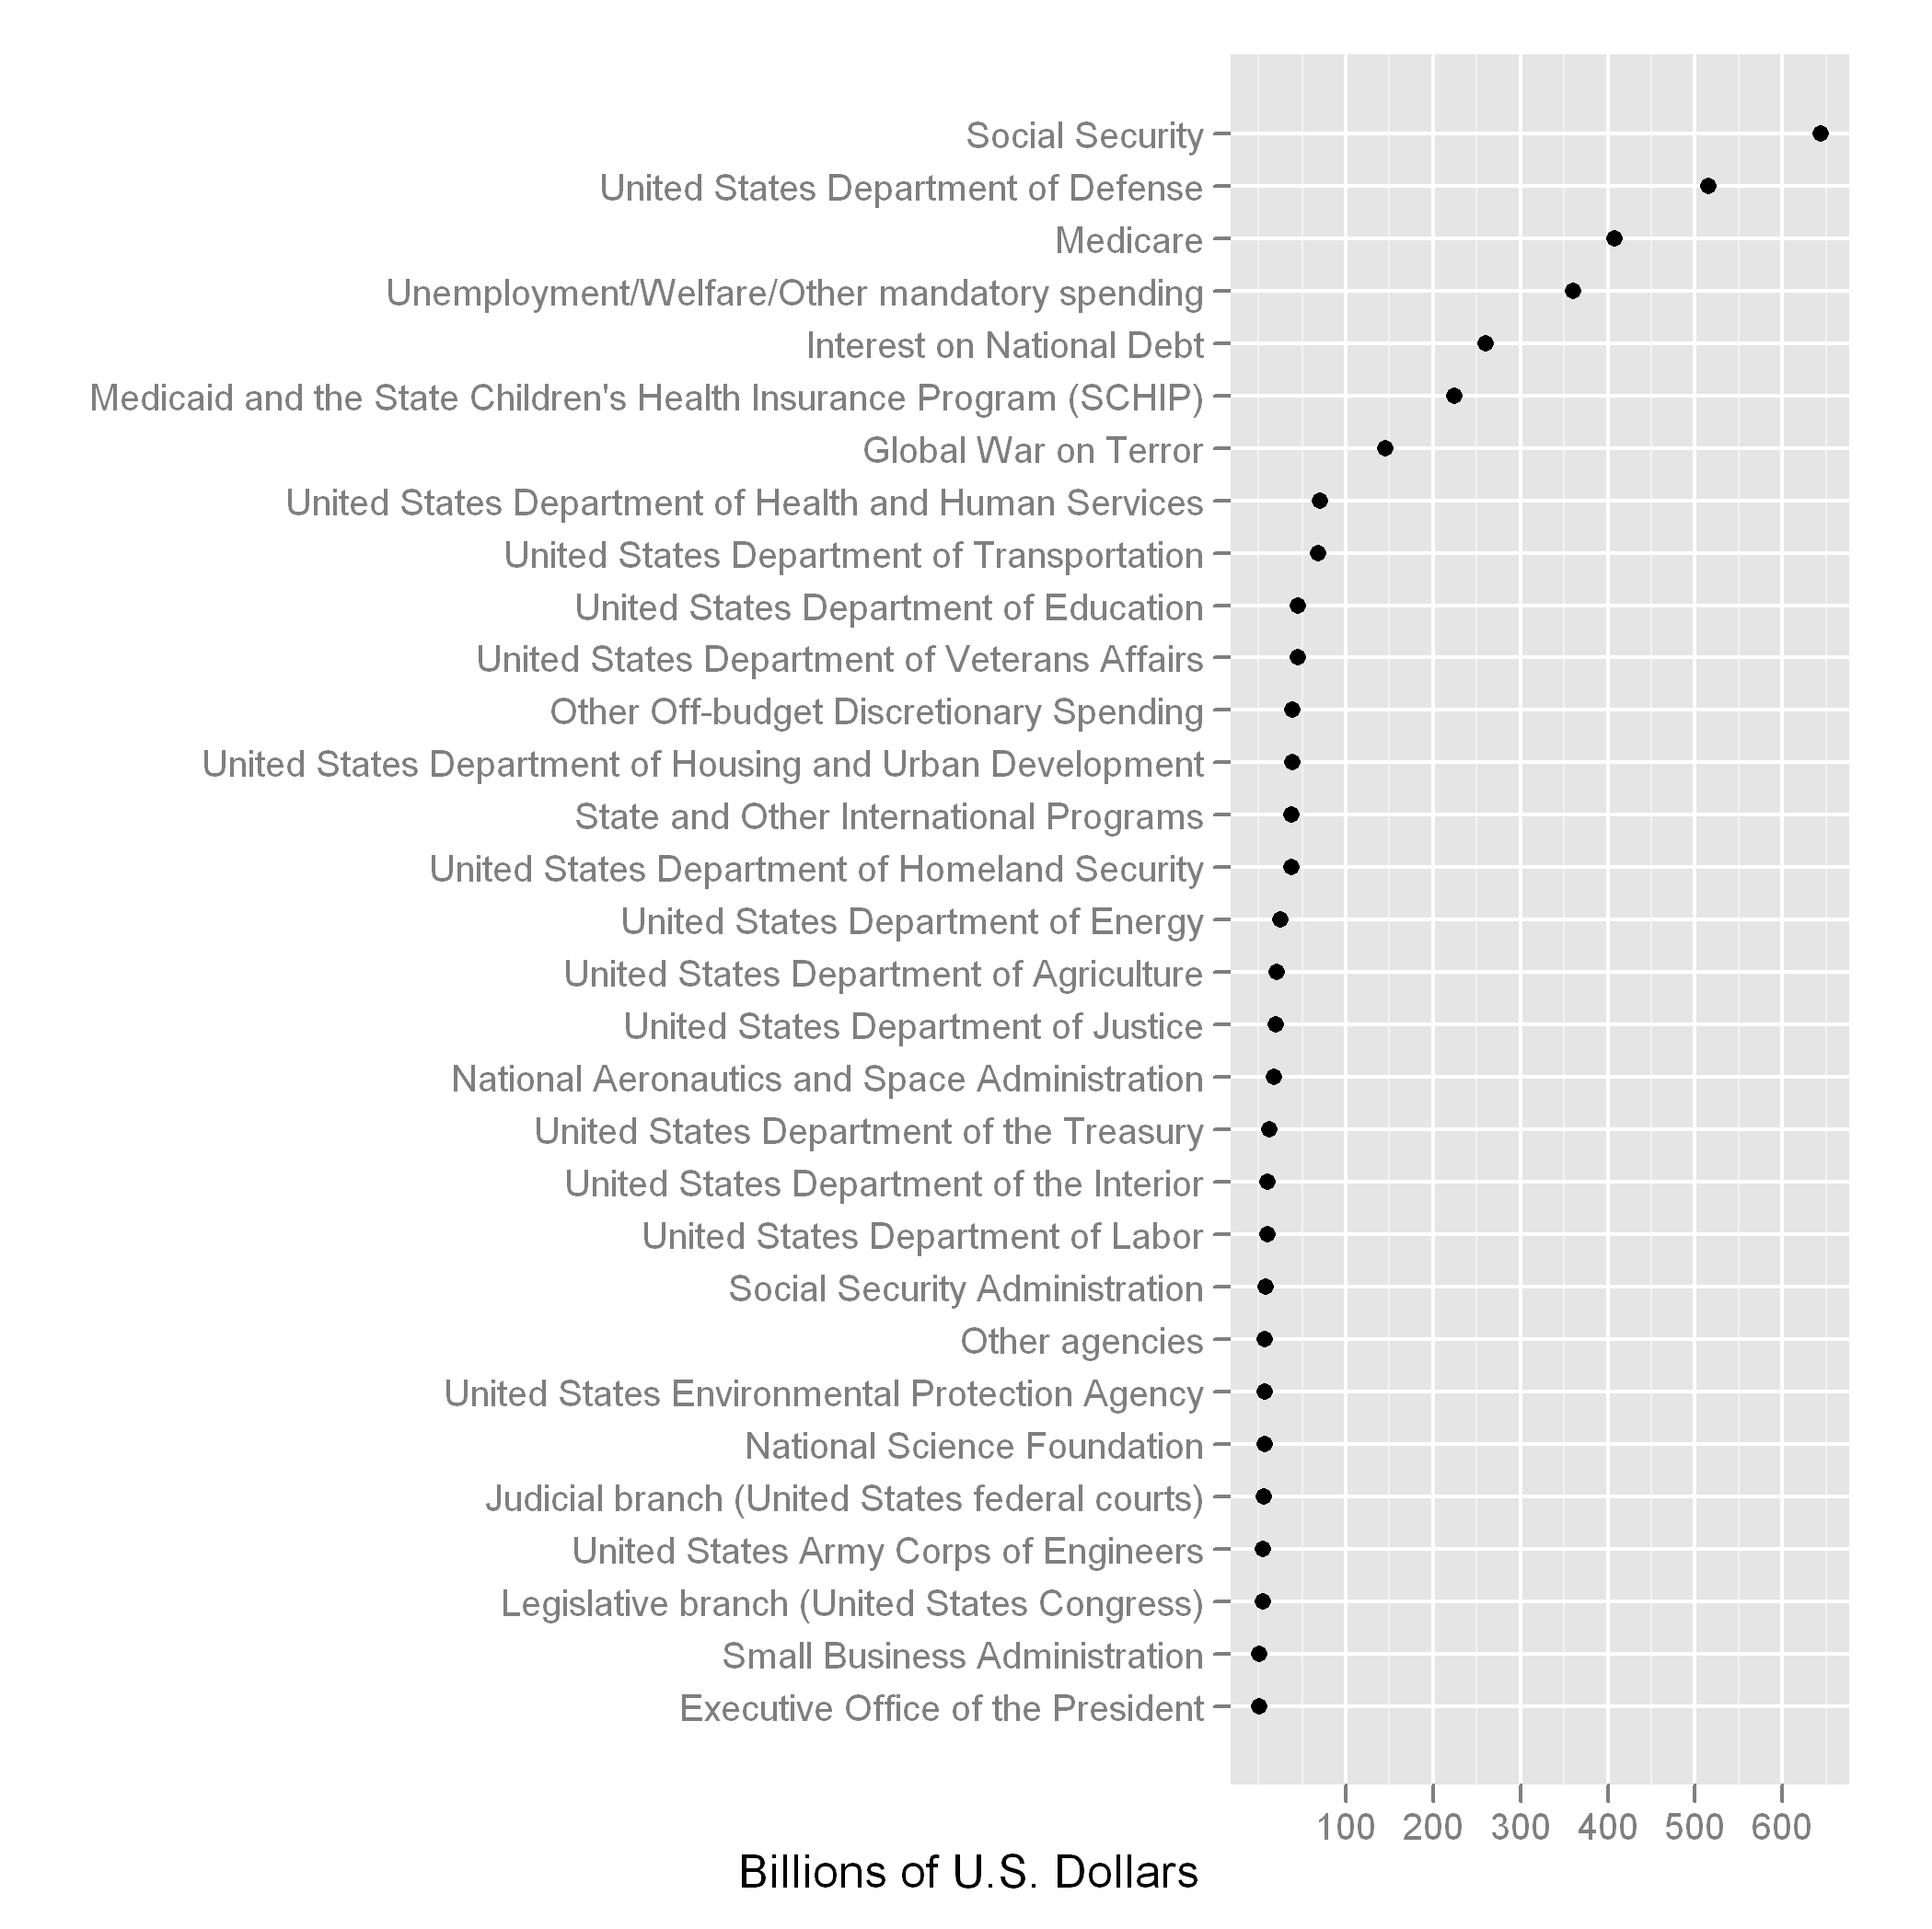
English: Dot plot of the total U.S. government budget in 2009, including both mandatory and discretionary. Taken from data at wikipedia:2009 United States federal budget. |
| 日期 | |
| 來源 | 自己的作品 |
| 作者 | Thopper |
| 其他版本 | File:Fy2009spendingbycategory2.png |
Creation Technique
General steps
- Compile data from list of budget items at wikipedia:2009 United States federal budget and save to a file (e.g. "2009expenditures.csv");
- Load data in R (programming language);
- Load the ggplot2 library;
- Assign the categorical variable (outlay) as a factor;
- Plot using the ggplot.
Compiling the data
- Compile the data into columns: one column for the budget expenditure (e.g. "Social Security," "Medicare," etc.) and the other for the amount ("644," "408," etc.).
- Name the columns "Expenditure" and "Billions" for the expenditure category and the amount (in billions of U.S. dollars), respectively.
- Save the data as comma-separated value file (csv).
R code to produce chart
# Load the ggplot2 library
library("ggplot2")

# Data saved using European separators ("." for thousands and "," for decimals), so use read.csv2().
# If data is saved using U.S. separators ("," for thousands and "." for decimals), use read.csv().
my.data <- read.csv2("2009expenditures.csv")

# Ensure that the categories are treated as factors
my.data <- data.frame(Billions = my.data$Billions, Expenditure = factor(my.data$Expenditure))

# Plot using ggplot2
ggplot(data = my.data, aes(Billions)) +
      geom_point(aes(y=reorder(Expenditure, Billions))) +
      xlab("Billions of U.S. Dollars") + ylab("")
授權條款
我,本作品的著作權持有者,決定用以下授權條款發佈本作品:
此檔案採用創用CC 姓名標示-相同方式分享 3.0 未在地化版本授權條款。
- 您可以自由:
- 分享 – 複製、發佈和傳播本作品
- 重新修改 – 創作演繹作品
- 惟需遵照下列條件:
- 姓名標示 – 您必須指名出正確的製作者,和提供授權條款的連結,以及表示是否有對內容上做出變更。您可以用任何合理的方式來行動,但不得以任何方式表明授權條款是對您許可或是由您所使用。
- 相同方式分享 – 如果您利用本素材進行再混合、轉換或創作,您必須基於如同原先的相同或兼容的條款,來分布您的貢獻成品。
檔案歷史
點選日期/時間以檢視該時間的檔案版本。
| 日期/時間 | 縮圖 | 尺寸 | 使用者 | 備註 | |
|---|---|---|---|---|---|
| 目前 | 2010年9月17日 (五) 14:34 | | 2,099 × 2,096(107 KB) | Thopper | {{Information |Description={{en|1=Dot plot of the total U.S. government budget in 2009, including both mandatory and discretionary. Taken from data at wikipedia:2009 United States federal budget.}} |Source={{own}} |Author=Thopper |Dat |
檔案用途
下列頁面有用到此檔案:
全域檔案使用狀況
以下其他 wiki 使用了這個檔案:
- cs.wikipedia.org 的使用狀況
- en.wikipedia.org 的使用狀況
- fr.wikipedia.org 的使用狀況
- pl.wikipedia.org 的使用狀況
- uk.wikipedia.org 的使用狀況
- www.wikidata.org 的使用狀況