
File:1951+ Percent of global area at temperature records - Seasonal comparison - NOAA.svg

此SVG文件的PNG预览的大小:800 × 560像素。 其他分辨率:320 × 224像素 | 640 × 448像素 | 1,024 × 717像素 | 1,280 × 896像素 | 2,560 × 1,792像素 | 2,000 × 1,400像素。
原始文件 (SVG文件,尺寸为2,000 × 1,400像素,文件大小:22 KB)
摘要
| 描述 |
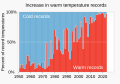
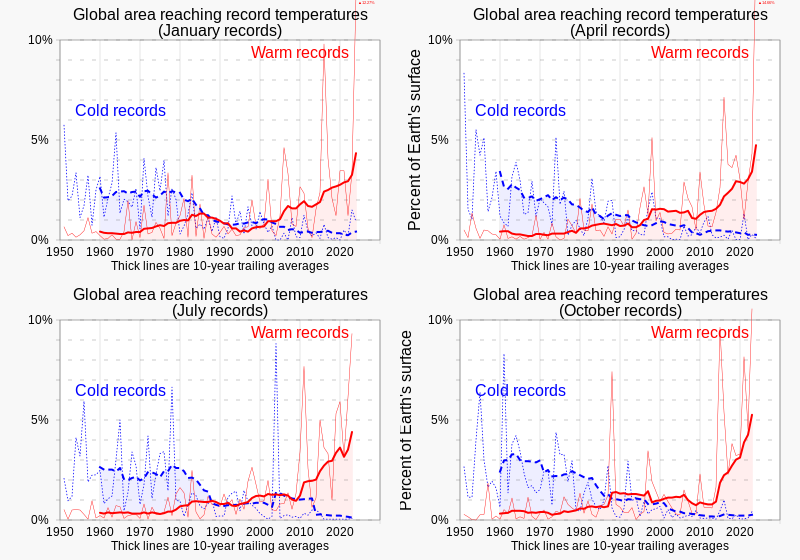
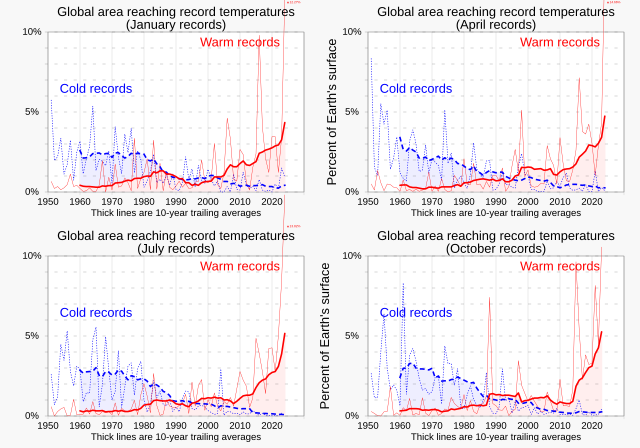
English: Charts comparing percentages of Earth's surface reaching record temperatures since 1951, comparing records for January, April, July and October, from NOAA data.
|
||
| 日期 | |||
| 来源 | 自己的作品 | ||
| 作者 | RCraig09 |

Related files
-
 01 January - Percent of global area at temperature records - Global warming - NOAA.svg
(January data) -
 02 February - Percent of global area at temperature records - Global warming - NOAA.svg
(February data) -
 03 March - Percent of global area at temperature records - Global warming - NOAA.svg
(March data) -
 04 April - Percent of global area at temperature records - Global warming - NOAA.svg
(April data) -
 05 May - Percent of global area at temperature records - Global warming - NOAA.svg
(May data) -
 06 June - Percent of global area at temperature records - Global warming - NOAA.svg
(June data)


-
 07 July - Percent of global area at temperature records - Global warming - NOAA.svg
(July data) -
 08 August - Percent of global area at temperature records - Global warming - NOAA.svg
(August data) -
 09 September - Percent of global area at temperature records - Global warming - NOAA.svg
(September data) -
 10 October - Percent of global area at temperature records - Global warming - NOAA.svg
(October data) -
 11 November - Percent of global area at temperature records - Global warming - NOAA.svg
(November data) -
 12 December - Percent of global area at temperature records - Global warming - NOAA.svg
(December data)


-
 1951+ Percent of global area at temperature records - Seasonal comparison - NOAA.svg
Seasonal comparison -
 1951 - Percent of global area at temperature records (monthly) - Global warming - NOAA.svg
All months scatterplot/dot plot -
 1951- RATIO of new record warm temperatures to new record cold temperatures (monthly) - Global warming.svg
Ratios scatterplot/dot plot (monthly) -
 1951- Percent of record temperatures that are cold or warm records.svg
 -
 1951- Warm and cold record temperatures - bar chart.svg

_-_Global_warming_-_NOAA.svg)
_-_Global_warming.svg)


许可协议
我,本作品著作权人,特此采用以下许可协议发表本作品:
本文件采用知识共享署名-相同方式共享 4.0 国际许可协议授权。
- 您可以自由地:
- 共享 – 复制、发行并传播本作品
- 修改 – 改编作品
- 惟须遵守下列条件:
- 署名 – 您必须对作品进行署名,提供授权条款的链接,并说明是否对原始内容进行了更改。您可以用任何合理的方式来署名,但不得以任何方式表明许可人认可您或您的使用。
- 相同方式共享 – 如果您再混合、转换或者基于本作品进行创作,您必须以与原先许可协议相同或相兼容的许可协议分发您贡献的作品。
文件历史
点击某个日期/时间查看对应时刻的文件。
| 日期/时间 | 缩略图 | 大小 | 用户 | 备注 | |
|---|---|---|---|---|---|
| 当前 | 2024年5月17日 (五) 04:20 | | 2,000 × 1,400(22 KB) | RCraig09 | Version 8: update to include new chart for April 2024 |
| 2024年2月24日 (六) 00:23 |  | 2,000 × 1,400(23 KB) | RCraig09 | Version 7: Update to include chart showing data for January 2024 | |
| 2023年11月16日 (四) 05:38 |  | 2,000 × 1,400(24 KB) | RCraig09 | Version 6: remove minor extraneous characters from October quadrant | |
| 2023年11月16日 (四) 05:34 |  | 2,000 × 1,400(24 KB) | RCraig09 | Version 5: Update with October 2023 chart | |
| 2023年8月15日 (二) 03:57 |  | 2,000 × 1,400(26 KB) | RCraig09 | Version 4: update to include July chart through 2023 | |
| 2023年7月30日 (日) 21:08 |  | 2,000 × 1,400(27 KB) | RCraig09 | Version 3: Add April and October graphics, for four-season comparison | |
| 2023年7月29日 (六) 04:00 | 2,000 × 700(13 KB) | RCraig09 | Version 2: re-centering some text strings | ||
| 2023年7月28日 (五) 22:37 | 2,000 × 700(13 KB) | RCraig09 | Uploaded own work with UploadWizard |
文件用途
以下页面使用本文件:
全域文件用途
以下其他wiki使用此文件:
- bn.wikipedia.org上的用途
- cs.wikipedia.org上的用途
- en.wikipedia.org上的用途
- ha.wikipedia.org上的用途
- id.wikipedia.org上的用途
- mk.wikipedia.org上的用途