
File:2005orange.PNG
本预览的尺寸:800 × 351像素。 其他分辨率:320 × 140像素 | 640 × 281像素 | 1,425 × 625像素。
原始文件 (1,425 × 625像素,文件大小:60 KB,MIME类型:image/png)
| 描述 |
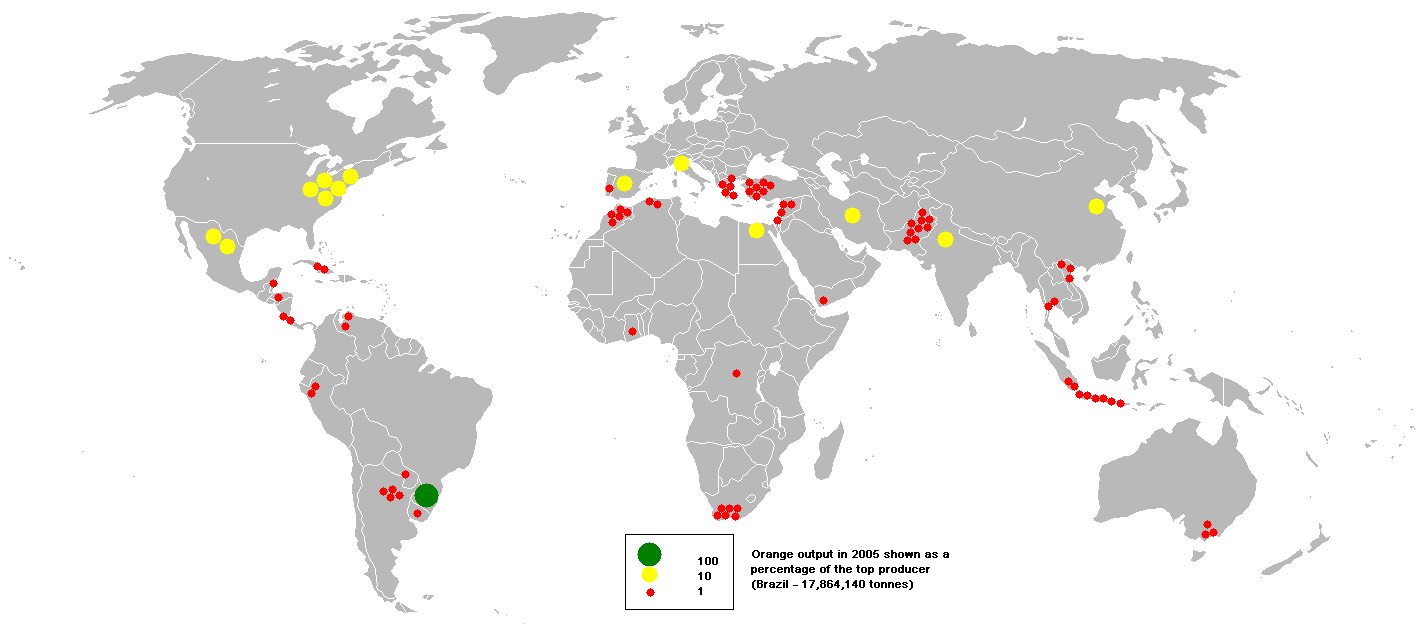
English: This bubble map shows the global distribution of orange output in 2005 as a percentage of the top producer (Brazil - 17,864,140 tonnes).
This map is consistent with incomplete set of data too as long as the top producer is known. It resolves the accessibility issues faced by colour-coded maps that may not be properly rendered in old computer screens. |
||
| 日期 | |||
| 来源 |
Data was extracted on 8th June 2007 from http://faostat.fao.org/site/336/DesktopDefault.aspx?PageID=336 Based on Image:BlankMap-World.png |
||
| 作者 | en:user:Anwar saadat | ||
| 授权 (二次使用本文件) |
|
文件历史
点击某个日期/时间查看对应时刻的文件。
| 日期/时间 | 缩略图 | 大小 | 用户 | 备注 | |
|---|---|---|---|---|---|
| 当前 | 2009年10月3日 (六) 19:24 | | 1,425 × 625(60 KB) | Serg!o | {{Information |Description={{en|This bubble map shows the global distribution of orange output in 2005 as a percentage of the top producer (Brazil - 17,864,140 tonnes). This map is consistent with incomplete set of |
文件用途
以下页面使用本文件:
全域文件用途
以下其他wiki使用此文件:
- ca.wikipedia.org上的用途
- eo.wikipedia.org上的用途
- es.wikipedia.org上的用途
- ka.wikipedia.org上的用途