
File:Births and Total fertility rate of Japan.svg

此SVG文件的PNG预览的大小:800 × 400像素。 其他分辨率:320 × 160像素 | 640 × 320像素 | 1,024 × 512像素 | 1,280 × 640像素 | 2,560 × 1,280像素 | 900 × 450像素。
原始文件 (SVG文件,尺寸为900 × 450像素,文件大小:117 KB)

|
该文件可能会更新以反映新信息 如果您希望在不镜像新更新的情况下使用该文件的特定版本,请将所需版本作为单独的文件上传。 |
摘要
| 描述 |
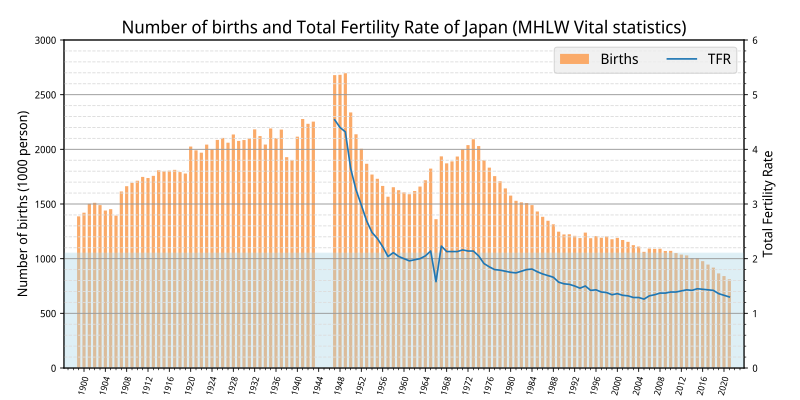
English: Births and Total fertility rate of Japan |
| 日期 | |
| 来源 |
自己的作品, Data from
|
| 作者 | Yuasan |
| 授权 (二次使用本文件) |
CC-0 |
许可协议
我,本作品著作权人,特此采用以下许可协议发表本作品:
| 本作品采用知识共享CC0 1.0 通用公有领域贡献许可协议授权。 | |
| 采用本宣告发表本作品的人,已在法律允许的范围内,通过在全世界放弃其对本作品拥有的著作权法规定的所有权利(包括所有相关权利),将本作品贡献至公有领域。您可以复制、修改、传播和表演本作品,将其用于商业目的,无需要求授权。
|
graph data
import matplotlib.pyplot as plt
from cycler import cycler
import pandas as pd
import numpy as np

df = pd.read_csv("data.tsv", index_col=0 , sep = "\t")

df1 = df.T.loc['TFR']		# line
df1 = df1.fillna(method='ffill')
df2 = df.T.loc['Births'].div(1000)	# bar

fig, ax = plt.subplots(figsize=(10, 5))
ax2 = ax.twinx()
plt.rcParams['font.family'] = 'sans-serif'
plt.rcParams['font.sans-serif'] = ['Noto Sans Display']

plt.subplots_adjust(left=0.08, bottom=0.08, right=0.93, top=0.90)

ax.bar(df2.index, df2, color="#FAAA69", width=0.6, label="Births")
ax.set_axisbelow(True)
ax.tick_params(axis='x', labelrotation=75)
ax.set_ylabel("Number of births (1000 person)", fontsize=12)
ax.set_ylim([0,3000])

ax2.set_ylabel("Total Fertility Rate", fontsize=12)
ax2.set_ylim([0,6])
ax2.axhspan(0,2.1, color="lightblue", alpha=0.4 , zorder=-10)
ax2.set_prop_cycle( plt.rcParams['axes.prop_cycle'] )
ax2.plot(df1, label="TFR")

ax.margins(0.02)
ax2.margins(0.02)

lines, labels = ax.get_legend_handles_labels()
lines2, labels2 = ax2.get_legend_handles_labels()
ax2.legend(lines + lines2, labels + labels2, facecolor="#eeeeee" ,
           ncol=2, fontsize=13,loc='upper right')

plt.title("Number of births and Total Fertility Rate of Japan (MHLW Vital statistics)", fontsize=16)

plt.setp(ax.get_xticklabels(), fontsize=8)
plt.setp(ax.get_yticklabels(), fontsize=9)
plt.xticks(np.arange(1900, 2021, step=4), fontsize=9)
plt.tick_params(labelsize=9, pad=4)

plt.minorticks_on()
plt.grid(which='major',color='#999999',linestyle='-', axis="y")
plt.grid(which='minor',color='#dddddd',linestyle='--', axis="y")

plt.savefig("image.svg")
Any autoconfirmed user can overwrite this file from the same source. Please ensure that overwrites comply with the guideline.
文件历史
点击某个日期/时间查看对应时刻的文件。
| 日期/时间 | 缩略图 | 大小 | 用户 | 备注 | |
|---|---|---|---|---|---|
| 当前 | 2023年8月1日 (二) 13:31 | | 900 × 450(117 KB) | Yuasan | stretch |
| 2023年1月3日 (二) 12:47 |  | 1,080 × 540(121 KB) | Yuasan | ipss data | |
| 2023年1月3日 (二) 12:25 |  | 1,080 × 540(121 KB) | Yuasan | fix TFR | |
| 2022年12月30日 (五) 13:51 |  | 1,080 × 540(89 KB) | Yuasan | Uploaded own work with UploadWizard |
文件用途
以下页面使用本文件:
全域文件用途
以下其他wiki使用此文件:
- en.wikipedia.org上的用途
- it.wikipedia.org上的用途
- ja.wikipedia.org上的用途
- ko.wikipedia.org上的用途
- uk.wikipedia.org上的用途