
File:Instrumental Temperature Record.png

本预览的尺寸:770 × 600像素。 其他分辨率:308 × 240像素 | 616 × 480像素 | 1,000 × 779像素。
原始文件 (1,000 × 779像素,文件大小:44 KB,MIME类型:image/png)
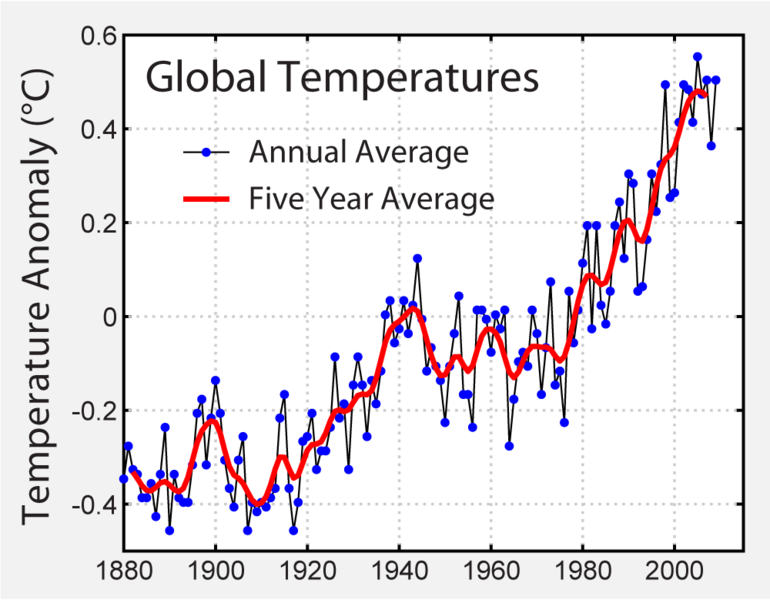
| 描述 | This image shows the instrumental record of global average w:temperatures as compiled by the w:NASA's w:Goddard Institute for Space Studies. (2006) "Global temperature change". Proc. Natl. Acad. Sci. 103: 14288-14293. Following the common practice of the w:IPCC, the zero on this figure is the mean temperature from 1961-1990. This figure was originally prepared by Robert A. Rohde from publicly available data and is incorporated into the Global Warming Art project. | |||
| 来源 | http://data.giss.nasa.gov/gistemp/graphs/ | |||
| 作者 | ||||
| 其他版本 |
此文件衍生的作品:
|

.svg)
Image from Global Warming Art
This image is an original work created for Global Warming Art. Please refer to the image description page for more information.

|
已授权您依据自由软件基金会发行的无固定段落及封面封底文字(Invariant Sections, Front-Cover Texts, and Back-Cover Texts)的GNU自由文件许可协议1.2版或任意后续版本的条款,复制、传播和/或修改本文件。该协议的副本请见“GNU Free Documentation License”。 |
| 本文件采用知识共享署名-相同方式共享 3.0 未本地化版本许可协议授权。 | ||
| ||
| 本许可协议标签作为GFDL许可协议更新的组成部分被添加至本文件。 |
| Dragons flight's Temperature Record Series |
| This figure is part of a series of plots created by Dragons flight to illustrate changes in Earth's temperature and climate across many different time scales. |
| Time Period: 25 yrs | 150 yrs | 1 kyr | 2 kyr | 12 kyr | 450 kyr | 5 Myr | 65 Myr | 500 Myr |
| For articles related to this topic see: Temperature record |
文件历史
点击某个日期/时间查看对应时刻的文件。
| 日期/时间 | 缩略图 | 大小 | 用户 | 备注 | |
|---|---|---|---|---|---|
| 当前 | 2010年2月20日 (六) 00:51 | | 1,000 × 779(44 KB) | Dragons flight | update to 2009 |
| 2009年2月4日 (三) 03:54 |  | 800 × 591(39 KB) | Dragons flight | update to 2008, change to GISS data | |
| 2008年2月21日 (四) 07:48 |  | 800 × 593(41 KB) | Dragons flight | update to 2007 | |
| 2005年9月2日 (五) 22:01 |  | 525 × 390(42 KB) | Wisty~commonswiki | Global warming picture from wikipedia |
文件用途
以下2个页面使用本文件:
全域文件用途
以下其他wiki使用此文件:
- ca.wikipedia.org上的用途
- ca.wikibooks.org上的用途
- ceb.wikipedia.org上的用途
- en.wikipedia.org上的用途
- User:Art Carlson
- User:Dragons flight/Images
- User:Bduke
- Talk:2006 Atlantic hurricane season/Archive 2
- User:Stephenpratt
- User:Ryttu3k
- Talk:Climate change/Archive 14
- User:Rolf Schmidt
- File talk:Instrumental Temperature Record.png
- User:AstroHurricane001/Userboxes
- User:Ts1and2fanatic
- Wikipedia:Reference desk/Archives/Science/2006 November 12
- User:Mwheatland
- Wikipedia:Reference desk/Archives/Science/2006 November 27
- User:Raul654/archive11
- Wikipedia talk:In the news/Archive 13
- User:Pastel kitten
- User:UBeR/GWcleanup
- Portal:Environment/Selected article
- Portal:Environment/Selected article/1
- Template talk:WikiProject Energy
- User:Mporter/Climate data
- Portal:Weather/Selected article/6
- Talk:Climate change/Archive 35
- User:NefariousPhD
- Talk:Climate change/Archive 37
- Talk:Climate change/Archive 39
- Talk:Climate change/Archive 40
- User:Universal Life
- User:Spartacus106
- User talk:Bender235/2008 archive
- User:Zemoxian
- User:Kurtis/Userboxes
- User:Vancemiller
- Wikipedia:Reference desk/Archives/Science/2009 September 17
- User:Rosalieroxx/testing
- User:RadicalOne/UBX Design
- User:RadicalOne/UBX Design/ClimateChange
- User:Wikip rhyre/UBX playground
- User:Mytwocents/Globalnull Warmingnull
- User:Cirripedius
- User:Saukkomies/My userboxes
- User:Zellfaze
- User:Finereach/United Kingdom climate change programme
- Talk:Climate change/Archive 59
- User:Cjeam
- User:EdwardLane
查看此文件的更多全域用途。