File:Logistic-t-normal-extreme-tails.svg

页面内容不支持其他语言。
這個文件來自維基共享資源
维基百科,自由的百科全书

原始文件(SVG文件,尺寸为630 × 630像素,文件大小:442 KB)


摘要

描述
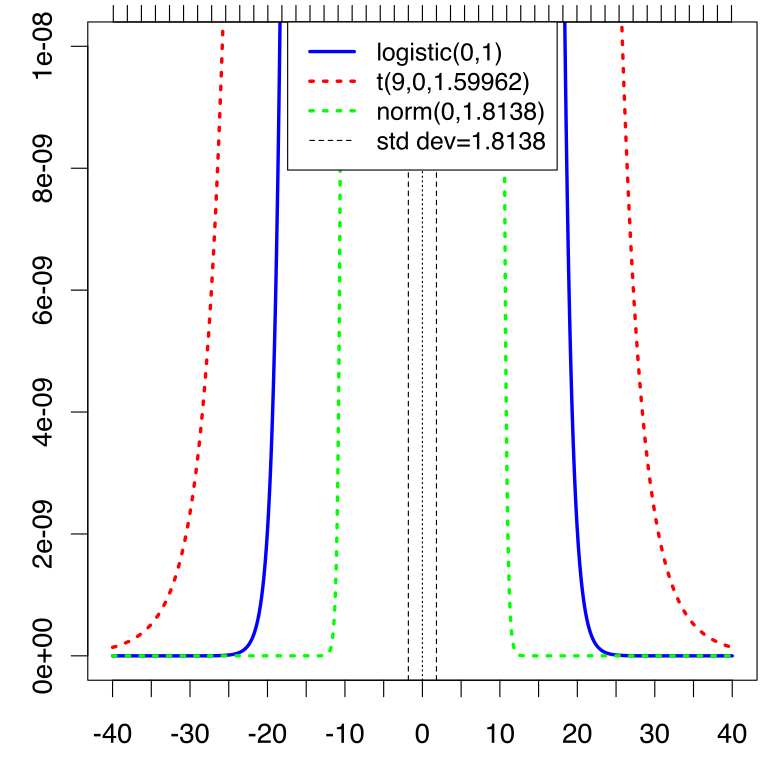
English: Comparison of standard logistic distribution with closest normal and Student's t distributions, by matching moments -- extreme tail portion.

Created using the following R code:

Source Code
logistic.t.norm.extreme.tails = function(xmin, xmax, yplot.max, filename) {
# Generate npoints from xmin to xmax
npoints=10000
scalefact=npoints/(xmax - xmin)
x=(xmin*scalefact):(xmax*scalefact)/scalefact

ylim=c(0,yplot.max) # Minimum and maximum Y limits
svg(filename)
# cex=font scaling, mai=margins (reduced as much as possible)
par(cex=1.5,mai=c(0.8,0.8,0.2,0.1))
# Plot blue logistic curve; lwd=line width, type="l" means use a line
plot(x,dlogis(x),type="l",xlab="", ylab="",lwd=3,col="blue",ylim=ylim,axes=FALSE)

# Somewhat annoying code just to get extra tick marks added without
# corresponding labels.  Here we add ticks every 5 units along the x axis, but
# labels only every 10 units, so they fit.
# NOTE: Assumes xmin=-40, xmax=40!  Needs to be generalized.
ticksat=-8:8*5
labels=ifelse(ticksat %% 10 == 0, sprintf("%d",ticksat),sprintf("",ticksat))
axis(1,at=-8:8*5,labels=labels) # 1=bottom
axis(2) # 2=left side; let the default algorithm work here
box() # Put back the box around the edge that axes=FALSE turned off

# Draw a dotted vertical line at 0 (lty=line type, 3=dotted)
abline(v=0,lty=3) 
# Set Student t params to match moments of logistic
df = 9; shape = sqrt((df-2)/df*pi*pi/3) 
# Plot red Student t curve; lwd=line width, lty=line type (3=dotted)
points(x,dt(x/shape,df)/shape,type="l",lty=3,col="red",lwd=3)
# Set normal params to match moments of logistic
sd = sqrt(pi*pi/3)
# Draw std dev lines (currently only at +/- 1 std dev, alternatively at all of them)
#for (sdevs in 1:floor(xmax/sd)) {
for (sdevs in 1:1) {
  abline(v=-sd*sdevs,lty=2) # Draw a dashed vertical line at -1 std dev (lty 2=dashed)
  abline(v=sd*sdevs,lty=2) # Draw a dashed vertical line at +1 std dev (lty 2=dashed)
}
# Add std dev ticks along the top
axis(3,at=-floor(xmax/sd):floor(xmax/sd)*sd,labels=FALSE)
# Plot green normal curve; lwd=line width, lty=line type (3=dotted)
points(x,dnorm(x,0,sd),type="l",lty=3,col="green",lwd=3)
# Draw legend in top center
legend("top", c("logistic(0,1)", sprintf("t(%g,0,%g)",df,shape), sprintf("norm(0,%g)", sd), sprintf("std dev=%g", sd)), cex=0.9,col = c("blue","red","green", "black"), lty=c(1,3,3,2),lwd=c(3,3,3,1))
dev.off()
}

logistic.t.norm.extreme.tails(-40,40,1e-8,"logistic-t-normal-extreme-tails.svg")
日期
来源 Created using R
作者 Benwing

许可协议

我,本作品著作权人,特此采用以下许可协议发表本作品:
GNU head 已授权您依据自由软件基金会发行的无固定段落及封面封底文字(Invariant Sections, Front-Cover Texts, and Back-Cover Texts)的GNU自由文件许可协议1.2版或任意后续版本的条款,复制、传播和/或修改本文件。该协议的副本请见“GNU Free Documentation License”。
w:zh:知识共享
署名 相同方式共享
This file is licensed under the Creative Commons Attribution-Share Alike 4.0 International, 3.0 Unported, 2.5 Generic, 2.0 Generic and 1.0 Generic license.
您可以自由地:
  • 共享 – 复制、发行并传播本作品
  • 修改 – 改编作品
惟须遵守下列条件:
  • 署名 – 您必须对作品进行署名,提供授权条款的链接,并说明是否对原始内容进行了更改。您可以用任何合理的方式来署名,但不得以任何方式表明许可人认可您或您的使用。
  • 相同方式共享 – 如果您再混合、转换或者基于本作品进行创作,您必须以与原先许可协议相同或相兼容的许可协议分发您贡献的作品。
您可以选择您需要的许可协议。

说明

添加一行文字以描述该文件所表现的内容

此文件中描述的项目

描繪內容

image/svg+xml

文件历史

点击某个日期/时间查看对应时刻的文件。

日期/时间缩⁠略⁠图大小用户备注
当前2012年3月28日 (三) 04:532012年3月28日 (三) 04:53版本的缩略图630 × 630(442 KB)Benwingadd std dev tick marks along top
2012年3月28日 (三) 03:282012年3月28日 (三) 03:28版本的缩略图630 × 630(432 KB)Benwing{{Information |description = {{en|1=Comparison of standard logistic distribution with closest normal and Student's t distributions, by matching moments -- extreme tail portion. Created using the following R code: {{cot|Source Code}} <source lang="rsplu...

以下页面使用本文件: