跳转到内容

File:Mandelbrot Creation Animation.gif

页面内容不支持其他语言。
這個文件來自維基共享資源
维基百科,自由的百科全书

Mandelbrot_Creation_Animation.gif (600 × 600像素,文件大小:1.78 MB,MIME类型:image/gif、​循环、​20帧、​20秒)


摘要

描述

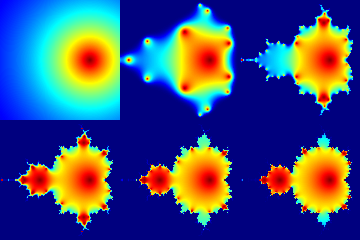
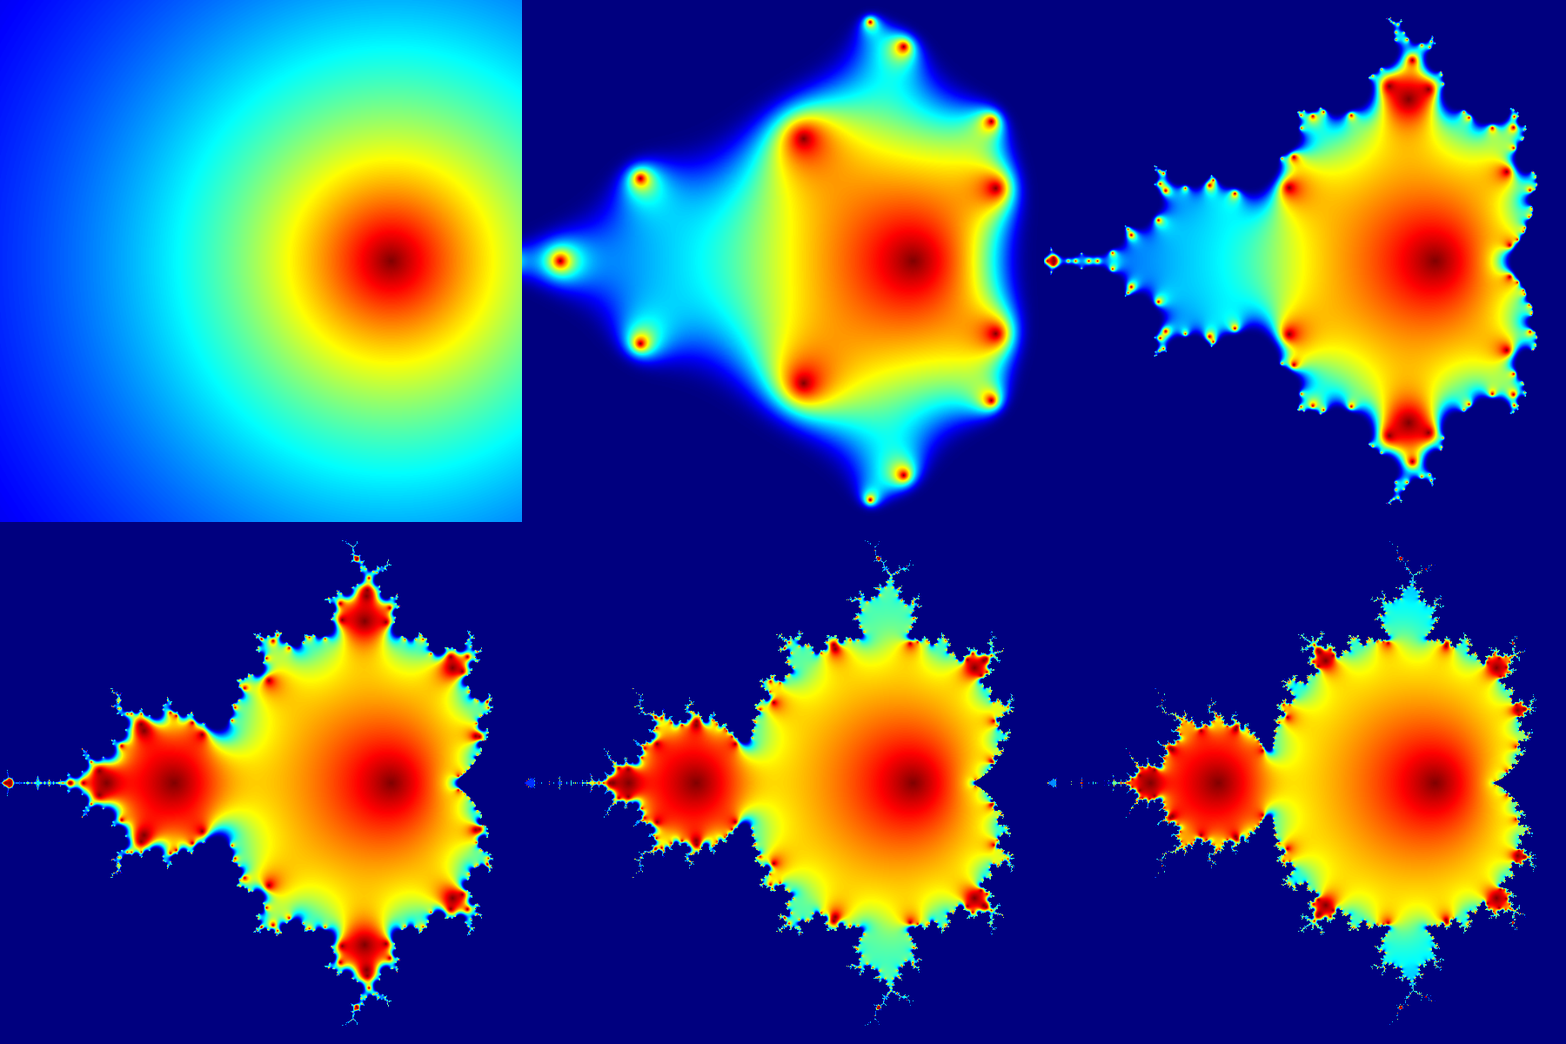
An animated diagram showing iterations of the equation used to generate the Mandelbrot set, a fractal first studied by Benoît Mandelbrot in 1979. The animation shows the values of Z for first 20 iterations of the equation

where c is a complex variable.

Mandelbrot set graphics are usually generated using the so-called "escape algorithm", where color is assigned according to the number of iterations it took for the equation to diverge past a pre-set limit, and black color is used for regions that never diverge. This, however, is a plot of a much simpler quantity: the actual values of the equation at the first 20 iterations. Every pixel in the image corresponds to a different value of a complex constant c ranging from -2.2 to 1 on the real axis (horizontal) and from -1.2i to 1.2i on the imaginary axis (vertical). Z is initialized to 0. At each iteration, the next value of Z is calculated using the equation above.

This graphic was generated with 13 lines of code in the R language (see below for the code). For each point, the magnitude (aka absolute value) of Z is calculated, than scaled using an exponential function to emphasize fine detail, and finally mapped to color palette (jetColors). Dark red is a very low number, dark blue is a very high number. The deep blue region "squeezing" in the boundaries of the fractal is the region where Z value diverges to infinity.
日期
来源 自己的作品
作者 Jarekt
其他版本 Mandelbrot Creation Animation (800x600).gif
GIF开发
InfoField
 
本GIF 位图使用R创作。
源代码
InfoField

R code

library(caTools)
jet.colors = colorRampPalette(c("#00007F", "blue", "#007FFF", "cyan", "#7FFF7F", "yellow", "#FF7F00", "red", "#7F0000")) 
m = 600
C = complex( real=rep(seq(-1.8,0.6, length.out=m), each=m ), 
             imag=rep(seq(-1.2,1.2, length.out=m), m ) ) 
C = matrix(C,m,m)
Z = 0 
X = array(0, c(m,m,20))
for (k in 1:20) { 
  Z = Z^2+C 
  X[,,k] = exp(-abs(Z)) 
} 
write.gif(X, "Mandelbrot.gif", col=jet.colors, delay=100)

许可协议

Jarekt,本作品著作权人,特此采用以下许可协议发表本作品:
GNU head 已授权您依据自由软件基金会发行的无固定段落及封面封底文字(Invariant Sections, Front-Cover Texts, and Back-Cover Texts)的GNU自由文件许可协议1.2版或任意后续版本的条款,复制、传播和/或修改本文件。该协议的副本请见“GNU Free Documentation License”。
w:zh:知识共享
署名 相同方式共享
本文件采用知识共享署名-相同方式共享4.0 国际3.0 未本地化版本2.5 通用2.0 通用1.0 通用许可协议授权。
署名: Jarekt
您可以自由地:
  • 共享 – 复制、发行并传播本作品
  • 修改 – 改编作品
惟须遵守下列条件:
  • 署名 – 您必须对作品进行署名,提供授权条款的链接,并说明是否对原始内容进行了更改。您可以用任何合理的方式来署名,但不得以任何方式表明许可人认可您或您的使用。
  • 相同方式共享 – 如果您再混合、转换或者基于本作品进行创作,您必须以与原先许可协议相同或相兼容的许可协议分发您贡献的作品。
您可以选择您需要的许可协议。

说明

添加一行文字以描述该文件所表现的内容

此文件中描述的项目

描繪內容

文件历史

点击某个日期/时间查看对应时刻的文件。

日期/时间缩⁠略⁠图大小用户备注
当前2007年6月13日 (三) 18:322007年6月13日 (三) 18:32版本的缩略图600 × 600(1.78 MB)Jarekt{{Information |Description=Animation GIF file showing iteration of creating Mandelbrot set image |Source=self-made |Date=06/13/2007 |Author= Jarekt }} Image generated using R language and executing the following code: library(caTools) jet

以下页面使用本文件:

全域文件用途

以下其他wiki使用此文件: