
File:PIA19716 Alice Solar Occultation.jpg

本预览的尺寸:800 × 450像素。 其他分辨率:320 × 180像素 | 640 × 360像素 | 1,280 × 720像素。
原始文件 (1,280 × 720像素,文件大小:243 KB,MIME类型:image/jpeg)
摘要
| 描述 |
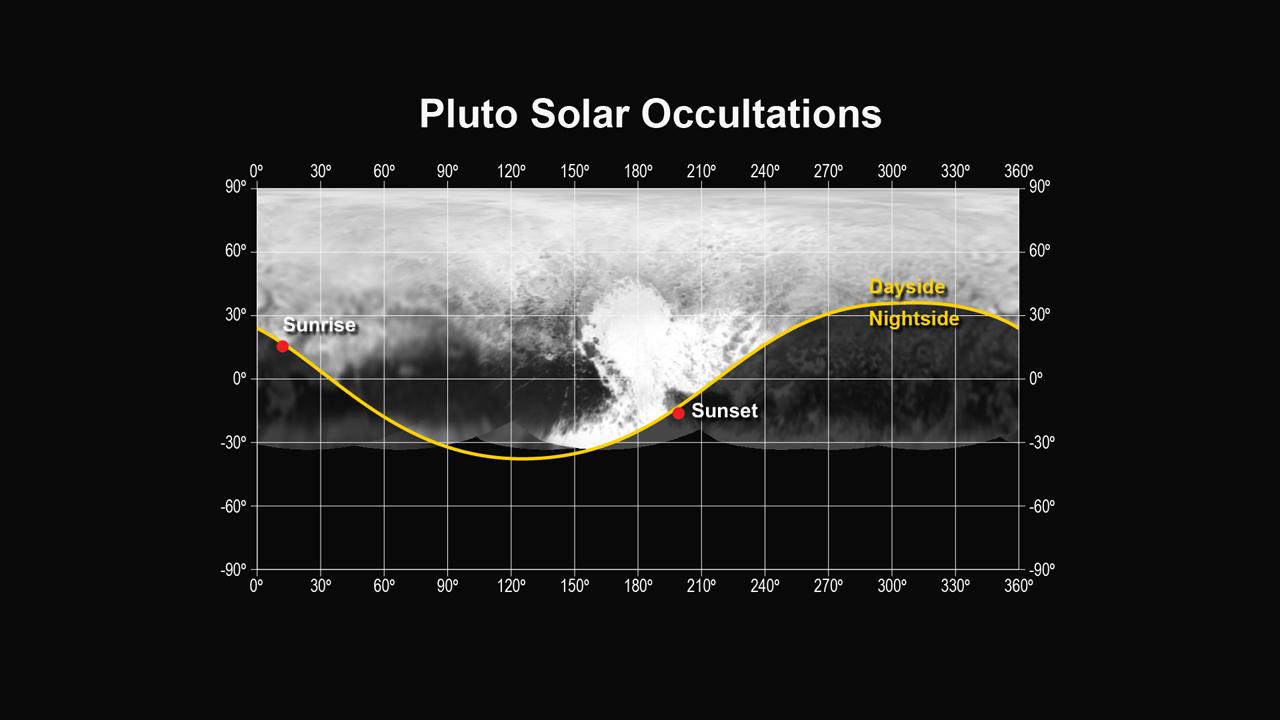
English: This figure shows how the Alice instrument count rate changed over time during the sunset and sunrise observations. The count rate is largest when the line of sight to the sun is outside of the atmosphere at the start and end times. Molecular nitrogen (N2) starts absorbing sunlight in the upper reaches of Pluto's atmosphere, decreasing as the spacecraft approaches the planet's shadow. As the occultation progresses, atmospheric methane and hydrocarbons can also absorb the sunlight and further decrease the count rate. When the spacecraft is totally in Pluto's shadow the count rate goes to zero. As the spacecraft emerges from Pluto's shadow into sunrise, the process is reversed. By plotting the observed count rate in the reverse time direction, it is seen that the atmospheres on opposite sides of Pluto are nearly identical.
The Johns Hopkins University Applied Physics Laboratory in Laurel, Maryland, designed, built, and operates the New Horizons spacecraft, and manages the mission for NASA's Science Mission Directorate. The Southwest Research Institute, based in San Antonio, leads the science team, payload operations and encounter science planning. New Horizons is part of the New Frontiers Program managed by NASA's Marshall Space Flight Center in Huntsville, Alabama. |
| 日期 | (published) |
| 来源 | Catalog page · Full-res (JPEG · TIFF) |
| 作者 | NASA/Johns Hopkins University Applied Physics Laboratory/Southwest Research Institute |
| 其他版本 |
|

.jpg)
| 此标签不表示文件的著作权状态。任何文件在附有此标签的同時还需要一个有效的著作权标签。请参阅许可协议说明页面以了解更多信息。 其他语言:
|
 |
This media is a product of the New Horizons mission Credit and attribution belongs to the Alice UV Spectrometer team, NASA/Johns Hopkins University Applied Physics Laboratory/Southwest Research Institute |
许可协议
| 本文件完全由NASA创作,在美国属于公有领域。根据NASA的版权方针,NASA的材料除非另有声明否则不受版权保护。(参见Template:PD-USGov/zh、NASA版权方针页面或JPL图片使用方针。) | ||
 |
警告:
|
文件历史
点击某个日期/时间查看对应时刻的文件。
| 日期/时间 | 缩略图 | 大小 | 用户 | 备注 | |
|---|---|---|---|---|---|
| 当前 | 2018年12月23日 (日) 03:58 | | 1,280 × 720(243 KB) | PhilipTerryGraham | Reverted to version as of 02:26, 14 November 2018 (UTC) Please upload it as a seperate file |
| 2018年12月21日 (五) 19:40 |  | 824 × 656(196 KB) | Sneeuwschaap | Reverted to version as of 22:12, 21 October 2018 (UTC): what's the sense of obvious decreasing of quality? | |
| 2018年11月14日 (三) 02:26 |  | 1,280 × 720(243 KB) | PhilipTerryGraham | Reverted to version as of 16:29, 18 July 2015 (UTC) Orignal file as published on the NASA Photojournal | |
| 2018年10月21日 (日) 22:12 |  | 824 × 656(196 KB) | Huntster | Cropping to center on chart box, rather than image as a whole. | |
| 2015年12月8日 (二) 01:48 |  | 824 × 656(196 KB) | Sneeuwschaap | Lossless cropping of black edges | |
| 2015年7月18日 (六) 16:29 |  | 1,280 × 720(243 KB) | Drbogdan | User created page with UploadWizard |
文件用途
没有页面链接到本图像。
全域文件用途
以下其他wiki使用此文件:
- pl.wikipedia.org上的用途
- ru.wikinews.org上的用途