
File:Stirling's Approximation.svg

此SVG文件的PNG预览的大小:771 × 600像素。 其他分辨率:309 × 240像素 | 617 × 480像素 | 988 × 768像素 | 1,280 × 996像素 | 2,560 × 1,991像素 | 2,700 × 2,100像素。
原始文件 (SVG文件,尺寸为2,700 × 2,100像素,文件大小:4 KB)
摘要
| 描述 |
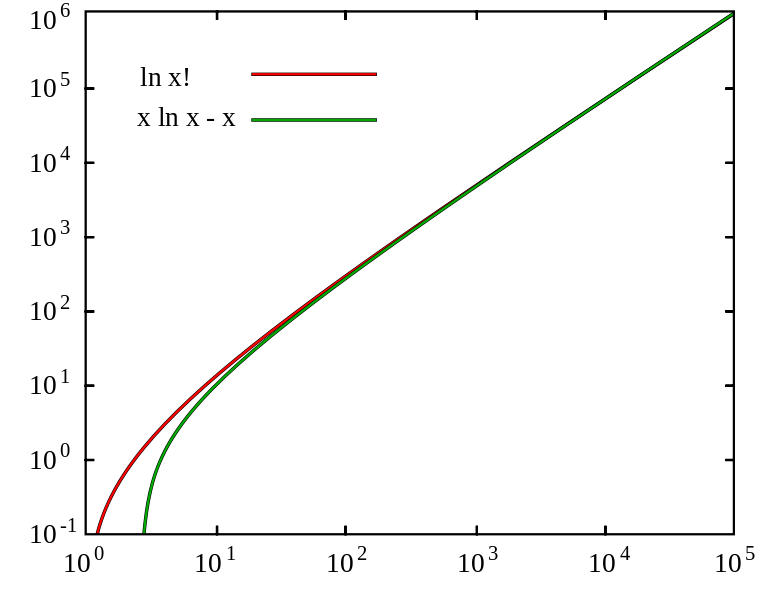
English: Stirling's approximation graph |
||
| 日期 | |||
| 来源 | Created by me | ||
| 作者 | R. A. Nonenmacher | ||
| 授权 (二次使用本文件) |
我,本作品著作权人,特此采用以下许可协议发表本作品:
This file is licensed under the Creative Commons Attribution-Share Alike 4.0 International, 3.0 Unported, 2.5 Generic, 2.0 Generic and 1.0 Generic license.
您可以选择您需要的许可协议。 |

SVG code
<?xml version="1.0" encoding="utf-8"?>
<!DOCTYPE svg PUBLIC "-//W3C//DTD SVG 1.1//EN" "http://www.w3.org/Graphics/SVG/1.1/DTD/svg11.dtd">
<svg version = "1.1"
     id      = "Stirling_approximation_graph"
     xmlns   = "http://www.w3.org/2000/svg"
     width   = "2700"
     height  = "2100">
<!-- ==================== Data Curves ===================== -->
<g fill="none">
   <path stroke="#000" stroke-width="12" d="M  340,1871 C 440,1470, 960,1110,2567,  50"/>
   <path stroke="#00f" stroke-width="8"  d="M  340,1871 C 440,1470, 960,1110,2567,  50"/>
   <path stroke="#000" stroke-width="12" d="M 2571,  46 C 660,1310, 544,1445, 504,1870"/>
   <path stroke="#f00" stroke-width="8"  d="M 2571,  46 C 660,1310, 544,1445, 504,1870"/>
</g>
<!-- ==================== Legend ===================== -->
<text x="490" y="300" font-size="96">ln x!</text>
<text x="480" y="440" font-size="96">x ln x - x</text>
<polyline stroke="#000" stroke-width="12" points="880,260 1320,260"/>
<polyline stroke="#00f" stroke-width="8"  points="882,260 1318,260"/>
<polyline stroke="#000" stroke-width="12" points="880,420 1320,420"/>
<polyline stroke="#f00" stroke-width="8"  points="882,420 1318,420"/>
<!-- ==================== Y-Axis Labels ===================== -->
<text x="100" y=" 100" font-size="96">10</text> <text x="210" y="  60" font-size="72">6</text>
<text x="100" y=" 340" font-size="96">10</text> <text x="210" y=" 300" font-size="72">5</text>
<text x="100" y=" 600" font-size="96">10</text> <text x="210" y=" 560" font-size="72">4</text>
<text x="100" y=" 860" font-size="96">10</text> <text x="210" y=" 820" font-size="72">3</text>
<text x="100" y="1120" font-size="96">10</text> <text x="210" y="1080" font-size="72">2</text>
<text x="100" y="1380" font-size="96">10</text> <text x="210" y="1340" font-size="72">1</text>
<text x="100" y="1640" font-size="96">10</text> <text x="210" y="1600" font-size="72">0</text>
<text x="100" y="1900" font-size="96">10</text> <text x="210" y="1860" font-size="72">-1</text>
<!-- ==================== X-Axis Labels ===================== -->
<text x="220 " y="2000" font-size="96">10</text> <text x="330 " y="1960" font-size="72">0</text>
<text x="680 " y="2000" font-size="96">10</text> <text x="790 " y="1960" font-size="72">1</text>
<text x="1140" y="2000" font-size="96">10</text> <text x="1250" y="1960" font-size="72">2</text>
<text x="1600" y="2000" font-size="96">10</text> <text x="1710" y="1960" font-size="72">3</text>
<text x="2060" y="2000" font-size="96">10</text> <text x="2170" y="1960" font-size="72">4</text>
<text x="2500" y="2000" font-size="96">10</text> <text x="2610" y="1960" font-size="72">5</text>
<!-- ================= Axes & Tick Marks ================== -->
<polygon fill="none" stroke="#000" stroke-width="8" points="
    300,  40   300, 310   330, 310   300, 310   300, 570   330, 570   300, 570
               300, 830   330, 830   300, 830   300,1090   330,1090   300,1090
               300,1350   330,1350   300,1350   300,1610   330,1610   300,1610
    300,1870   760,1870   760,1840   760,1870  1210,1870  1210,1840  1210,1870
              1670,1870  1670,1840  1670,1870  2120,1870  2120,1840  2120,1870
   2570,1870  2570,1610  2540,1610  2570,1610  2570,1350  2540,1350  2570,1350
              2570,1090  2540,1090  2570,1090  2570, 830  2540, 830  2570, 830
              2570, 570  2540, 570  2570, 570  2570, 310  2540, 310  2570, 310
   2570,  40  2120,  40  2120,  70  2120,  40  1670,  40  1670,  70  1670,  40
              1210,  40  1210,  70  1210,  40   760,  40   760,  70   760,  40"/>
</svg>
W3C-validity not checked.
文件历史
点击某个日期/时间查看对应时刻的文件。
| 日期/时间 | 缩略图 | 大小 | 用户 | 备注 | |
|---|---|---|---|---|---|
| 当前 | 2011年10月19日 (三) 23:18 | | 2,700 × 2,100(4 KB) | Bender2k14 | fixed problem with display of the first two x-axis labels by moving the white space before the number values (instead of after) |
| 2008年8月19日 (二) 23:59 |  | 2,700 × 2,100(4 KB) | Nonenmac | == Summary == {{Information |Description={{en|1=Stirling's approximation graph}} |Source=Created by me |Author=R. A. Nonenmacher |Date=18-Aug-2008 |Permission={{self|GFDL|cc-by-sa-all}} |other_versions=[[:I |
文件用途
以下页面使用本文件:
全域文件用途
以下其他wiki使用此文件:
- be.wikipedia.org上的用途
- cs.wikipedia.org上的用途
- el.wikipedia.org上的用途
- fr.wikipedia.org上的用途
- it.wikipedia.org上的用途
- kk.wikipedia.org上的用途
- ko.wikipedia.org上的用途
- lt.wikipedia.org上的用途
- mn.wikipedia.org上的用途
- ro.wikipedia.org上的用途
- ru.wikipedia.org上的用途
- sk.wikipedia.org上的用途
- uk.wikipedia.org上的用途