跳转到内容

File:Energyfig.png

页面内容不支持其他语言。
这个文件来自维基共享资源
维基百科,自由的百科全书

Energyfig.png (506 × 554像素,文件大小:108 KB,MIME类型:image/png


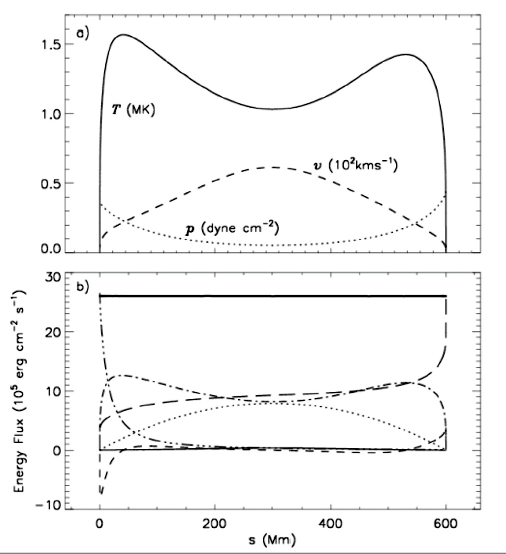
描述 The above figure was produced by Dr Ian O'Neill and Dr Xing Li during research into the energy balance in a long coronal loop (600 million meters long in this example). This is a modelled coronal loop using a full-implicit, 2-fluid numerical method which solves the basic plasma equations simultaneously. In the figure, the top panel shows the plasma parameters along the coronal loop length, where plasma temperature (T in million Kelvin or 106K), velocity (v in 102 kilometers per second) and pressure (p in dyne per cm-2) are displayed. As can be seen, we are dealing with plasma temperatures of over 1.5MK. The lower panel demonstrates the energy sources (kinetic, gravity, enthalpy, wave fluxes) and energy sinks (conduction, radiation fluxes). With reference to the figure, the followeing energy flux corresponds to different traces on the graph: kinetic energy flux (thin solid line), gravitational flux (dotted), radiative flux (long-dash), conductive flux (short-dash), enthalpy flux (dot-dash), wave flux (triple-dot-dash) and the total flux (thick solid line). The total flux must remain constant to confirm steady state.
来源 English Wikipedia (here)
作者 These results are published in: O'Neill, I. J. and X. Li, Coronal loops heated by turbulence-driven Alfvén waves: A two fluid model, A&A, 435, pages 1159-1167, 2005 (link to ADS).


本作品已被作者中文维基百科项目的Eeron80释出到公有领域。这适用于全世界。

如果这样做不合法的话:
Eeron80无条件地授予任何人以任何目的使用本作品的权利,除非这些条件是法律规定所必需的。

说明

添加一行文字以描述该文件所表现的内容

此文件中描述的项目

描绘内容

文件历史

点击某个日期/时间查看对应时刻的文件。

日期/时间缩⁠略⁠图大小用户备注
当前2008年4月29日 (二) 16:542008年4月29日 (二) 16:54版本的缩略图506 × 554(108 KB)Henrykus{{Information |Description=The above figure was produced by [http://www.astroengine.net/astro/projects.shtml Dr Ian O'Neill] and [http://users.aber.ac.uk/xxl Dr Xing Li] during research into the energy balance in a long coronal loop (600 million meters lo

以下页面使用本文件:

全域文件用途

以下其他wiki使用此文件: