// **********
// Constantes et initialisation
// **********

clear;
clf;

chdir('monchemin/')

// Paramètres de Newton-Raphson
precision = 1e-7; // condition d'arrêt
itermax = 60; // idem

// Précision de la linéarisation approchée
epsilon = 1e-6;

// **********
// Fonctions
// **********

exec('fonctions_communes.sce', -1)

function [e] = res(Yexp, Ycal)
    e = sqrt(sum((Yexp-Ycal).^2));
endfunction

function [A, R] = gaussnewton(f, X, Yexp, A0, imax, epsilon)
    // A : jeu de paramètres optimisé par régression (vecteur)
    // R : liste des facteurs de qualité de la régression
    // pour chaque étape (vecteur)
    // X : variable explicative (vecteur)
    // Yexp : variable expliquée, valeurs mesurées (vecteur)
    // A0 : paramètres d'initialisation du modèle (vecteur)
    // epsilon : valeur d'arrêt (scalaire)
    k = 1; // facteur d'amortissement initial, <=1,
    // évite la divergence
    n = size(X,'*');
    e0 = sqrt(sum(Yexp.^2)); // normalisation du facteur de qualité
    Ycal = f(A0, X); // modèle initial
    R(1) = res(Yexp, Ycal)/e0; // facteur de qualité initial
    disp('i = 1 ; k = 1 ; R = '+string(R(1))) // affichage param initiaux
    i = 1;
    B = A0;
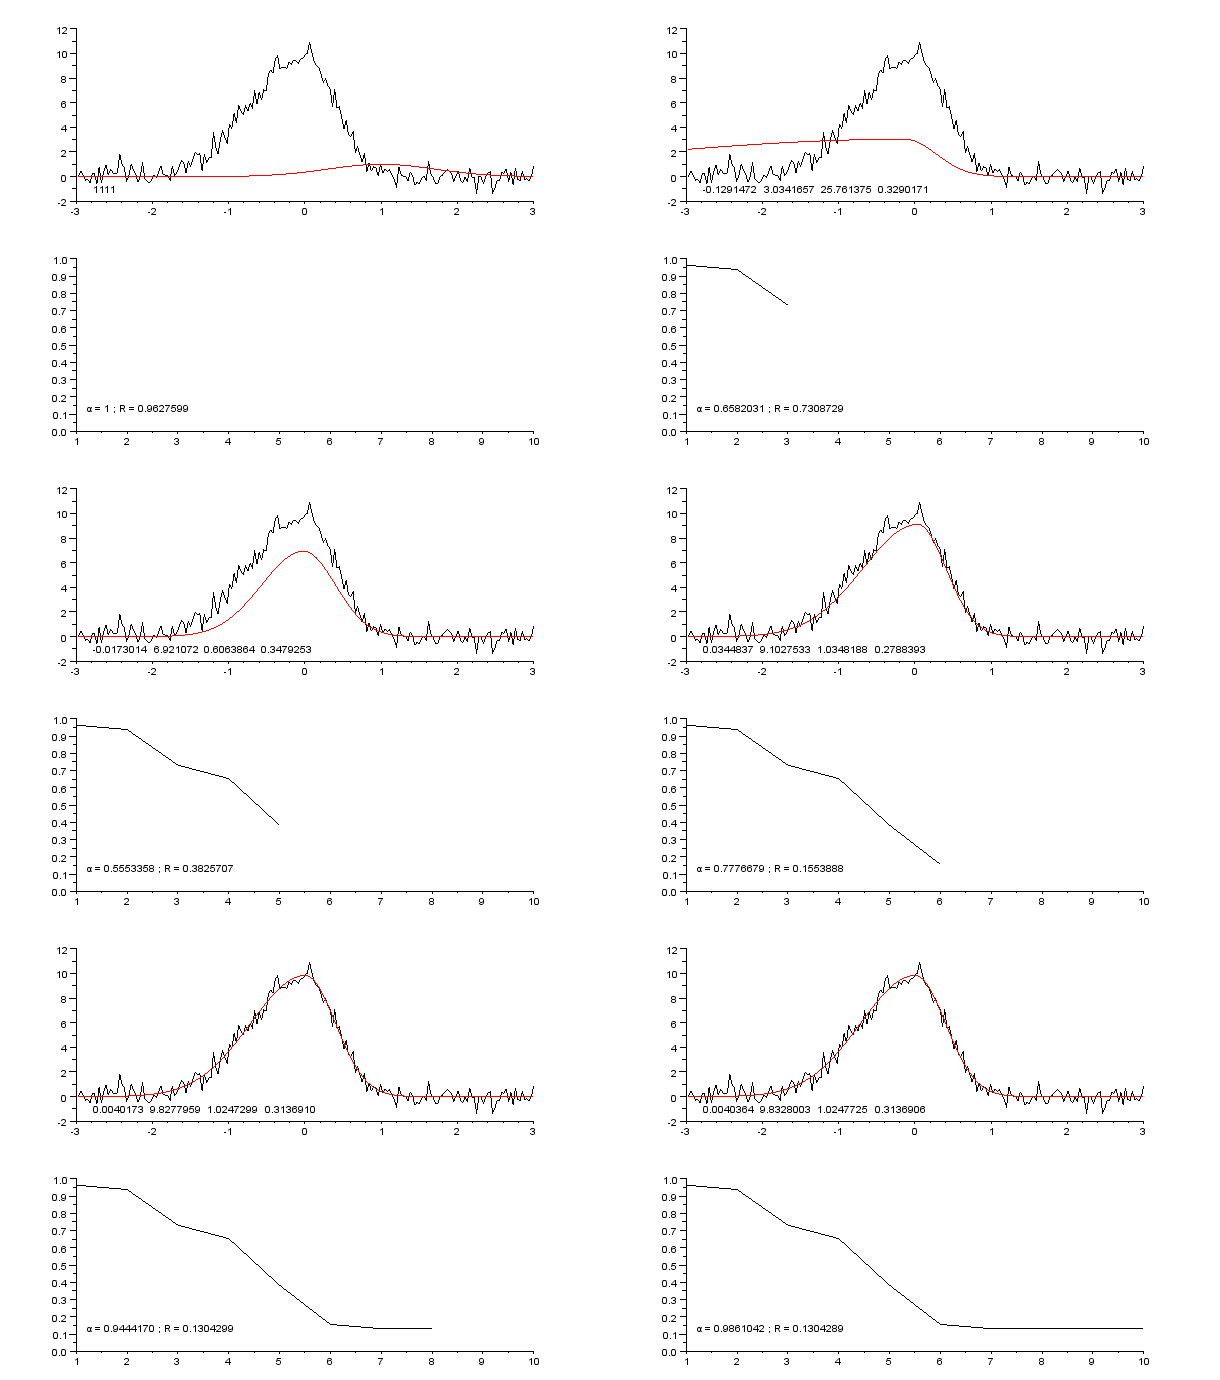
        subplot(2,1,1)
        plot2d(X, Yexp, rect=[-3, -2, 3, 12])
        plot(X, Ycal, "-r")
        xstring(-2.8, -1.5, string(B))
        subplot(2,1,2)
        plot2d(R, rect=[1, 0, 10, 1])
        xstring(1.2, 0.1, 'α = '+string(k)+' ; R = '+string(R(i)))
        nom = 'picassym'+string(i)+'.gif';
        xs2gif(0,nom)
    drapeau = %t;
    while (i < imax) & drapeau // teste la convergence globale
        i = i+1;
        deltay = Yexp - Ycal;
        J = linearisation_approchee(f, B, X, epsilon); // matrice jacobienne
        tJ = J'; // transposée
        deltap0 = inv((tJ*J))*tJ*deltay;
        drapeau2 = %t // pour une 1re exécution
        while drapeau2 & (k>0.1) // teste la divergence sur 1 étape
            deltap = k*deltap0;
            Bnouveau = B + deltap';
            Ycal = f(Bnouveau, X);
            R(i) = res(Yexp, Ycal)/e0;
            drapeau2 = (R(i) >= R(i-1)) // vrai si diverge
            if drapeau2 then k = k*0.75; // atténue si diverge
            else k0 = k; // pour affichage de la valeur
                k = (1 + k)/2; // réduit l'atténuation si converge
            end
        end
        B = Bnouveau;
        drapeau = abs(R(i-1) - R(i)) > epsilon
        clf;
        subplot(2,1,1)
        plot2d(X, Yexp, rect=[-3, -2, 3, 12])
        plot(X, Ycal, "-r")
        xstring(-2.8, -1.5, string(B))
        subplot(2,1,2)
        plot2d(R, rect=[1, 0, 10, 1])
        xstring(1.2, 0.1, 'α = '+string(k0)+' ; R = '+string(R(i)))
        nom = 'picassym'+string(i)+'.gif';
        xs2gif(0,nom)
//        disp('i = '+string(i)+' ; k = '+string(k0)+' ; R = '+string(R(i)))
    end
    A = B;
endfunction

// **********
// Programme principal
// **********

// lecture des données
donnees = read('pic_gauss_dissym_bruite.txt',-1,2);

// carcatéristiques des données
Xdef = donnees(:,1);
Ydef = donnees(:,2);
// Ainit = [-0.03, 9.7, 8*((0.84 - 0.03)/2.35)^2, 8*((0.45 + 0.03)/2.35)^2];
Ainit = [1, 1, 1, 1];

// Régression
tic();
[Aopt, Rnr] =...
    gaussnewton(gauss_dissym, Xdef, Ydef,...
    Ainit, itermax, precision)
t = toc();

// Courbe calculée

Yopt = gauss_dissym(Aopt, Xdef);

// Affichage

print(%io(2),Ainit)
print(%io(2),Aopt)
print(%io(2),t)

clf

subplot(2,1,1)
plot(Xdef, Ydef, "-b")
plot(Xdef, Yopt, "-r")

subplot(2,1,2)
plot(Rnr)


