File:Scatter plot.jpg
外观
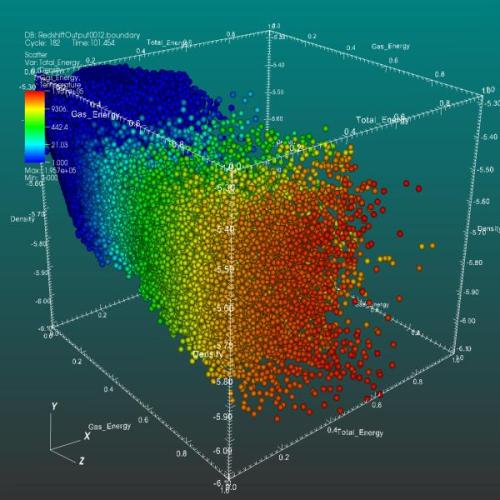
Scatter_plot.jpg (500 × 500像素,文件大小:40 KB,MIME类型:image/jpeg)
文件历史
点击某个日期/时间查看对应时刻的文件。
| 日期/时间 | 缩略图 | 大小 | 用户 | 备注 | |
|---|---|---|---|---|---|
| 当前 | 2008年7月10日 (四) 22:34 |  | 500 × 500(40 KB) | Mdd | {{Information |Description={{en|1=Scatter plot VisIt's Scatter plot allows you to visualize multivariate data of up to four dimensions. The Scatter plot takes multiple scalar variables and uses them for different axes in phase space. The different variab |
文件用途
全域文件用途
以下其他wiki使用此文件:
- ar.wikipedia.org上的用途
- bn.wikipedia.org上的用途
- ca.wikipedia.org上的用途
- de.wikipedia.org上的用途
- en.wikipedia.org上的用途
- en.wikiversity.org上的用途
- et.wikipedia.org上的用途
- eu.wikipedia.org上的用途
- fa.wikipedia.org上的用途
- gl.wikipedia.org上的用途
- id.wikipedia.org上的用途
- it.wikipedia.org上的用途
- ja.wikipedia.org上的用途
- pt.wikipedia.org上的用途
- ro.wikipedia.org上的用途
- ru.wikipedia.org上的用途
- simple.wikipedia.org上的用途
- sl.wikipedia.org上的用途
- sr.wikipedia.org上的用途
- sv.wikipedia.org上的用途
- uk.wikipedia.org上的用途


