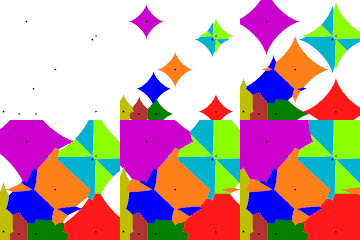
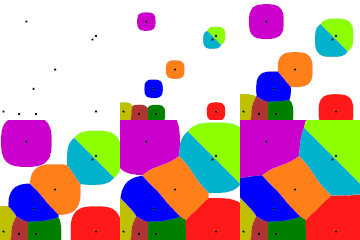
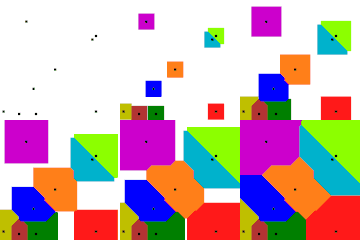
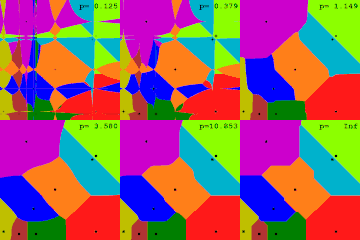
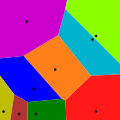
File:Voronoi growth euclidean.gif
页面内容不支持其他语言。
外观
Voronoi_growth_euclidean.gif (500 × 500像素,文件大小:1.24 MB,MIME类型:image/gif、循环、200帧、10秒)
摘要
| 描述Voronoi growth euclidean.gif |
Deutsch: Voronoi-Diagramm erstellt durch Wachstum mit dem Euklidischer Abstand (bzw. p-Norm mit p=2) aus neun Zentren.
English: Voronoi diagram crated by the growth from nine seeds using the Euclidean distance (or Minkowski distance with p=2.) |
| 日期 | |
| 来源 | 自己的作品 |
| 作者 | Jahobr |
| 其他版本 |
|
| GIF开发 InfoField | |
| 源代码 InfoField | MATLAB codefunction Voronoi_growth
% source code that produces a GIF.
%
% 2017-07-29 Jahobr (reworked 2017-10-03)
[pathstr,fname] = fileparts(which(mfilename)); % save files under the same name and at file location
imageMax = [500, 500]; % pixel (height width)
scaleReduction = 5; % the size reduction: adds antialiasing
nFrames = 200;
seedsDef = [... relative to image size
0.28 0.26; ... 1
0.30 0.05; ... 2
0.03 0.07; ... 3
0.77 0.67; ... 4
0.22 0.82; ... 5
0.46 0.42; ... 6
0.16 0.05; ... 7
0.80 0.07; ... 8
0.80 0.70]; % 9
rawIndexImage.colormap = [...
0 0 1.00;... 1 blue
0 0.50 0 ;... 2 dark green
0.75 0.75 0 ;... 3 yellow
0 0.70 0.80;... 4 cyan
0.80 0 0.80;... 5 magenta
1.00 0.50 0.10;... 6 orange
0.70 0.20 0.20;... 7 brown
1.00 0.1 0.1 ;... 8 red
0.55 1.00 0 ;... 9 bright green
0 0 0 ;... black (seeds)
1 1 1 ];% white (background)
nSeeds = size(seedsDef,1);
figHandle1 = figure(2347541);clf;hold on
xlim([0 1]); ylim([0 1]);
%%%%%%%%%%%%%%%%%%%%%%%%%%%%%%%%%%%%%%%%%%%%%%%%%%%%%%%%%%%%%%%%%%%%%%%%%%%
%%%%%%%%%%%%%%%%%%%% SVG %%%%%%%%%%%%%%%%%%%%
paddingSeeds = [... the main seeds grow to inifinity; so no path can be drawn; this extra seeds act as boundary
+3 0.0; ... nSeeds+1
+3 +3 ; ... nSeeds+2
0.0 +3 ; ... nSeeds+3
-3 +3 ; ... nSeeds+4
-3 0.0; ... nSeeds+5
-3 -3 ; ... nSeeds+6
0.0 -3 ; ... nSeeds+7
+3 -3 ]; % nSeeds+8
figHandle2 = figure(12554461); clf; % text rendering-figure
set(figHandle2,'Units','pixel');
set(figHandle2,'Position',[1 1 imageMax(2) imageMax(1)]); % big start image for antialiasing later [x y width height]
axesHandle = axes; hold(axesHandle,'on')
set(axesHandle,'Position',[0 0 1 1]); % stretch axis bigger as figure, [x y width height]
set(axesHandle,'XTick',NaN) % get rid of ticks
set(axesHandle,'YTick',NaN) % get rid of ticks
set(axesHandle,'TickLength',[0 0]) % get rid of ticks
xlim([0 1]); ylim([0 1]);
[v,c] = voronoin([seedsDef;paddingSeeds]);
for iSeed = 1:nSeeds % scetch of points
p = patch('Faces',c{iSeed},'Vertices',v,'FaceColor',rawIndexImage.colormap(iSeed,:),'EdgeColor','none');
end
plot(seedsDef(:,1),seedsDef(:,2),'.k','MarkerSize',30);
if ~isempty(which('plot2svg'))
plot2svg(fullfile(pathstr, 'Voronoi_static_euclidean.svg'),figHandle2) % by Juerg Schwizer
else
disp('plot2svg.m not available; see http://www.zhinst.com/blogs/schwizer/');
end
%%%%%%%%%%%%%%%%%%%%%%%%%%%%%%%%%%%%%%%%%%%%%%%%%%%%%%%%%%%%%%%%%%%%%%%%%%%
%%%%%%%%%%%%%%%%%%%% Voronoi_growth %%%%%%%%%%%%%%%%%%%%
seeds = round(seedsDef.*(ones(nSeeds,1)*imageMax).*scaleReduction); % convert unit from "rel" to pixel
[X,Y] = meshgrid(1:imageMax(2)*scaleReduction,1:imageMax(1)*scaleReduction); % pixel coordinates
versionList{1} = 'minkowski_p0_125'; p(1) = 0.125;
versionList{2} = 'minkowski_p0_707'; p(2) = 2^-0.5;
versionList{3} = 'cityblock'; p(3) = 1;
versionList{4} = 'minkowski_p1_25'; p(4) = 1.25;
versionList{5} = 'euclidean'; p(5) = 2;
versionList{6} = 'minkowski_p3'; p(6) = 3;
versionList{7} = 'chebychev'; p(7) = Inf;
for versionNr = 1:numel(versionList)
curVers = versionList{versionNr};
[MinDistMat,MinPointIndexMat] = pdist2(seeds,[X(:),Y(:)],'minkowski',p(versionNr),'Smallest',1);
MinDistMat = reshape(MinDistMat, imageMax*scaleReduction); % minimum dist-matrix from pixel next point
MinPointIndexMat = reshape(MinPointIndexMat,imageMax*scaleReduction); % index nearest neighbour to each pixel
distancePoint = imageMax(1)*scaleReduction*(0.01 + 0.0012/p(versionNr)^3); % black start point size
distanceList = linspace(distancePoint, max(MinDistMat(:))+eps,nFrames); % growths steps from start point to full coverage
rawIndexImage.cdata = ones(imageMax*scaleReduction)*nSeeds+2; % all in background color
reducedRGBimage = ones(imageMax(1),imageMax(2),3,nFrames); % allocate
for iFrame = 1:nFrames
currentGrowthDist = distanceList(iFrame);
colorPixel = MinDistMat <= currentGrowthDist; % in Range
if iFrame == 1
rawIndexImage.cdata(colorPixel) = nSeeds+1; % start-Point color
else
rawIndexImage.cdata(colorPixel) = MinPointIndexMat(colorPixel); % area color (using the index)
end
MinDistMat(colorPixel) = Inf; % mark as "done"
rawRGBimage = ind2rgb(rawIndexImage.cdata,rawIndexImage.colormap);
tempImage = d_imReduceSize(rawRGBimage,scaleReduction); % the size reduction: adds antialiasing
figure(figHandle1);clf
image(flipud(tempImage)); % show current state
reducedRGBimage(:,:,:,iFrame) = tempImage;
end
map = d_createImMap(reducedRGBimage,64,rawIndexImage.colormap(1:end,:)); % colormap
im = uint8(ones(imageMax(1),imageMax(2),1,nFrames));
for iFrame = 1:nFrames
im(:,:,1,iFrame) = flipud(rgb2ind(reducedRGBimage(:,:,:,iFrame),map,'nodither'));
end
imwrite(im,map,fullfile(pathstr, [fname '_' curVers '.gif']),'DelayTime',1/25,'LoopCount',inf) % save gif
disp([fname '_' curVers '.gif has ' num2str(numel(im)/10^6 ,4) ' Megapixels']) % Category:Animated GIF files exceeding the 50 MP limit
end
%%%%%%%%%%%%%%%%%%%%%%%%%%%%%%%%%%%%%%%%%%%%%%%%%%%%%%%%%%%%%%%%%%%%%%%%%%%
%%%%%%%%%%%%%%%%%%%% p-Sweep %%%%%%%%%%%%%%%%%%%%
p_sweep = 4.^([(-1.5:0.02:2.5) Inf]);
nFrames = numel(p_sweep);
reducedRGBimage = ones(imageMax(1),imageMax(2),3,nFrames); % allocate
rawIndexImage.cdata = ones(imageMax*scaleReduction)*nSeeds+2; % all in background color
figure(figHandle2); clf; % text rendering-figure
set(figHandle2,'Units','pixel');
%set(figHandle2,'GraphicsSmoothing','on') % requires at least version 2014b
set(figHandle2,'Position',[1 1 imageMax(2) imageMax(1)]); % big start image for antialiasing later [x y width height]
set(figHandle2,'Color' ,'white'); % white background
axesHandle = axes; hold(axesHandle,'on');
set(axesHandle,'Position',[0 0 1 1]); % stretch axis bigger as figure, [x y width height]
axis off; % invisible axes (no ticks)
xlim([0 1]); ylim([0 1]); drawnow;
for iFrame = 1:nFrames
% pause(0.1)
[MinDistMat,MinPointIndexMat] = pdist2(seeds,[X(:),Y(:)],'minkowski',p_sweep(iFrame),'Smallest',1);
MinDistMat = reshape(MinDistMat, imageMax*scaleReduction); % minimum dist-matrix from pixel next point
MinPointIndexMat = reshape(MinPointIndexMat,imageMax*scaleReduction); % index nearest neighbour to each pixel
rawIndexImage.cdata = MinPointIndexMat; % area color (using the index)
distancePoint = imageMax(1)*scaleReduction*(0.01 + 0.0012/p_sweep(iFrame)^3); % black start point size
colorPixel = MinDistMat <= distancePoint; % in Range
rawIndexImage.cdata(colorPixel) = nSeeds+1; % start-Point color
rawRGBimage = ind2rgb(flipud(rawIndexImage.cdata),rawIndexImage.colormap);
tempImage = d_imReduceSize(rawRGBimage,scaleReduction); % the size reduction: adds antialiasing
figure(figHandle2); cla % text rendering-figure
text(0.983,0.983,sprintf('p=%6.3f',p_sweep(iFrame)),'FontName','FixedWidth','FontSize',imageMax(1)/20,'FontWeight','bold','HorizontalAlignment','right','VerticalAlignment','top')
drawnow;
f = getframe(figHandle2);
tempImage = tempImage-(1-double(f.cdata)./255); % combine voronoi & text
tempImage(tempImage<0) = 0; % correct too dark pixel
reducedRGBimage(:,:,:,iFrame) = tempImage;
figure(figHandle1);clf
image(tempImage); % show current state
drawnow;
end
map = d_createImMap(reducedRGBimage,64,rawIndexImage.colormap(1:end-1,:)); % colormap without white; sweep-animation is fully filled
im = uint8(ones(imageMax(1),imageMax(2),1,nFrames));
for iFrame = 1:nFrames
im(:,:,1,iFrame) = rgb2ind(reducedRGBimage(:,:,:,iFrame),map,'nodither');
end
imwrite(im,map,fullfile(pathstr, 'Voronoi_p_sweep.gif'),'DelayTime',1/10,'LoopCount',inf) % save gif
disp(['Voronoi_p_sweep.gif has ' num2str(numel(im)/10^6 ,4) ' Megapixels']) % Category:Animated GIF files exceeding the 50 MP limit
%%%%%%%%%%%%%%%%%%%%%%%%%%%%%%%%%%%%%%%%%%%%%%%%%%%%%%%%%%%%%%%%%%%%%%%%%%%
%%%%%%%%%%%%%%%%%% Seed-Movement %%%%%%%%%%%%%%%%%%
ellipseDiameter = [... relative to image size
0.8 0.8; ... 1 blue
0.6 0.75;... 2 dark green
0.9 0.1; ... 3 yellow
0.7 0.25;... 4 cyan
0.7 0.5; ... 5 magenta
0.6 0.6; ... 6 orange
0.2 0.9; ... 7 brown
0.35 0.8; ... 8 red
0.8 0.5];% 9 bright green
angleOffset = pi/180*[230; 260; 185; 310; 140; 225; 260; 280; 45];
% 1b 2da-g 3y 4c 5m 6o 7br 8r 9br-g
direction = [1; 1; 1; -1; 1; -1; -1; 1; -1 ];
imageMax = [350, 350]; % pixel (height width)
scaleReduction = 5; % the size reduction: adds antialiasing
nFrames = 408;
[X,Y] = meshgrid(1:imageMax(2)*scaleReduction,1:imageMax(1)*scaleReduction); % pixel coordinates
figure(figHandle1);clf;hold on
angleList = linspace(0,2*pi,nFrames+1);
angleList = angleList(1:end-1);
for iFrame = 1:nFrames
cla
xlim([0 1]); ylim([-1 0]);
for iSeed = 1:nSeeds % scetch of points
angle = angleList*direction(iSeed)+angleOffset(iSeed);
xp=cos(angle)*ellipseDiameter(iSeed,1)/2;
yp=sin(angle)*ellipseDiameter(iSeed,2)/2;
trajectX(iSeed,:)=xp-xp(1)+seedsDef(iSeed,1);
trajectY(iSeed,:)=yp-yp(1)+seedsDef(iSeed,2);
% plot(trajectX(iSeed,:),-trajectY(iSeed,:),'.','Color',rawIndexImage.colormap(iSeed,:));
% plot(trajectX(iSeed,iFrame),-trajectY(iSeed,iFrame),'p','Color',rawIndexImage.colormap(iSeed,:));
end
drawnow; pause(.05)
end
reducedRGBimage = ones(imageMax(1),imageMax(2),3,nFrames); % allocate
trajectX = round(trajectX*imageMax(2)*scaleReduction); % in pixel x or horizontal
trajectY = round(trajectY*imageMax(1)*scaleReduction); % in pixel y of vertical
for versionNr = 1:numel(versionList)
curVers = versionList{versionNr};
for iFrame = 1:nFrames
% pause(0.1)
[MinDistMat,MinPointIndexMat] = pdist2([trajectX(:,iFrame),trajectY(:,iFrame)],[X(:),Y(:)],'minkowski',p(versionNr),'Smallest',1);
MinDistMat = reshape(MinDistMat, imageMax*scaleReduction); % minimum dist-matrix from pixel next point
MinPointIndexMat = reshape(MinPointIndexMat,imageMax*scaleReduction); % index nearest neighbour to each pixel
rawIndexImage.cdata = MinPointIndexMat; % area color (using the index)
distancePoint = imageMax(1)*scaleReduction*(0.01 + 0.0012/p(versionNr)^3); % black start point size
colorPixel = MinDistMat <= distancePoint; % in Range
rawIndexImage.cdata(colorPixel) = nSeeds+1; % start-Point color
rawRGBimage = ind2rgb(rawIndexImage.cdata,rawIndexImage.colormap);
tempImage = d_imReduceSize(rawRGBimage,scaleReduction); % the size reduction: adds antialiasing
reducedRGBimage(:,:,:,iFrame) = tempImage;
figure(figHandle1);clf
image(flipud(tempImage)); % show current state
drawnow;
end
map = d_createImMap(reducedRGBimage,128,rawIndexImage.colormap(1:end-1,:)); % colormap without white; sweep-animation is fully filled
im = uint8(ones(imageMax(1),imageMax(2),1,nFrames));
for iFrame = 1:nFrames
im(:,:,1,iFrame) = flipud(rgb2ind(reducedRGBimage(:,:,:,iFrame),map,'nodither'));
end
imwrite(im,map,fullfile(pathstr, ['Voronoi_move_' curVers '.gif']),'DelayTime',1/25,'LoopCount',inf) % save gif
disp(['Voronoi_move_' curVers '.gif has ' num2str(numel(im)/10^6 ,4) ' Megapixels']) % Category:Animated GIF files exceeding the 50 MP limit
end
%%%%%%%%%%%%%%%%%%%%%%%%%%%%%%%%%%%%%%%%%%%%%%%%%%%%%%%%%%%%%%%%%%%%%%%%%%%
%%%%%%%%%%%%%%%%%%%% PNG %%%%%%%%%%%%%%%%%%%%
imageMax = [2000, 2000]; % pixel (height width)
scaleReduction = 5; % the size reduction: adds antialiasing
seeds = round(seedsDef.*(ones(nSeeds,1)*imageMax).*scaleReduction); % convert unit from "rel" to pixel
[X,Y] = meshgrid(1:imageMax(2)*scaleReduction,1:imageMax(1)*scaleReduction); % pixel coordinates
for versionNr = 1:numel(versionList)
curVers = versionList{versionNr};
[MinDistMat,MinPointIndexMat] = pdist2(seeds,[X(:),Y(:)],'minkowski',p(versionNr),'Smallest',1);
MinDistMat = reshape(MinDistMat, imageMax*scaleReduction); % minimum dist-matrix from pixel next point
MinPointIndexMat = reshape(MinPointIndexMat,imageMax*scaleReduction); % index nearest neighbour to each pixel
distancePoint = imageMax(1)*scaleReduction*(0.01 + 0.0012/p(versionNr)^3); % black start point size
colorPixel = MinDistMat <= distancePoint; % in Range
MinPointIndexMat(colorPixel) = nSeeds+1; % start-Point color
rawRGBimage = flipud(ind2rgb(MinPointIndexMat,rawIndexImage.colormap));
im = d_imReduceSize(rawRGBimage,scaleReduction); % the size reduction: adds antialiasing
imwrite(im,fullfile(pathstr, ['Voronoi_static_' curVers '.png'])) % save png
disp(['Voronoi_static_' curVers '.png saved']) % Category:Animated GIF files exceeding the 50 MP limit
end
function im = d_imReduceSize(im,redSize)
% Input:
% im: image, [imRows x imColumns x nChannel x nStack] (double)
% imRows, imColumns: must be divisible by redSize
% nChannel: usually 3 (RGB) or 1 (grey)
% nStack: number of stacked images
% usually 1; >1 for animations
% redSize: 2 = half the size (quarter of pixels)
% 3 = third the size (ninth of pixels)
% ... and so on
% Output:
% imNew: double([imRows/redSize x imColumns/redSize x nChannel x nStack])
%
% an alternative is: imNew = imresize(im,1/reduceImage,'bilinear');
% BUT 'bicubic' & 'bilinear' produces fuzzy lines
% IMHO this function produces nicer results as "imresize"
[nRow,nCol,nChannel,nStack] = size(im);
if redSize==1; return; end % nothing to do
if redSize~=round(abs(redSize)); error('"redSize" must be a positive integer'); end
if rem(nRow,redSize)~=0; error('number of pixel-rows must be a multiple of "redSize"'); end
if rem(nCol,redSize)~=0; error('number of pixel-columns must be a multiple of "redSize"'); end
nRowNew = nRow/redSize;
nColNew = nCol/redSize;
im = im.^2; % brightness rescaling from "linear to the human eye" to the "physics domain"; see youtube: /watch?v=LKnqECcg6Gw
im = reshape(im, nRow, redSize, nColNew*nChannel*nStack); % packets of width redSize, as columns next to each other
im = sum(im,2); % sum in all rows. Size of result: [nRow, 1, nColNew*nChannel]
im = permute(im, [3,1,2,4]); % move singleton-dimension-2 to dimension-3; transpose image. Size of result: [nColNew*nChannel, nRow, 1]
im = reshape(im, nColNew*nChannel*nStack, redSize, nRowNew); % packets of width redSize, as columns next to each other
im = sum(im,2); % sum in all rows. Size of result: [nColNew*nChannel, 1, nRowNew]
im = permute(im, [3,1,2,4]); % move singleton-dimension-2 to dimension-3; transpose image back. Size of result: [nRowNew, nColNew*nChannel, 1]
im = reshape(im, nRowNew, nColNew, nChannel, nStack); % putting all channels (rgb) back behind each other in the third dimension
im = sqrt(im./redSize^2); % mean; re-normalize brightness: "scale linear to the human eye"; back in uint8
function map = d_createImMap(imRGB,nCol,startMap)
% d_createImMap creates a color-map including predefined colors.
% "rgb2ind" creates a map but there is no option to predefine some colors,
% and it does not handle stacked images.
% Input:
% imRGB: image, [imRows x imColumns x 3(RGB) x nStack] (double)
% nCol: total number of colors the map should have, [integer]
% startMap: predefined colors; colormap format, [p x 3] (double)
imRGB = permute(imRGB,[1 2 4 3]); % step1; make unified column-image (handling possible nStack)
imRGBcolumn = reshape(imRGB,[],1,3,1); % step2; make unified column-image
fullMap = permute(imRGBcolumn,[1 3 2]); % "column image" to color map
[fullMap,~,imMapColumn] = unique(fullMap,'rows'); % find all unique colors; create indexed colormap-image
% "cmunique" could be used but is buggy and inconvenient because the output changes between "uint8" and "double"
nColFul = size(fullMap,1);
nColStart = size(startMap,1);
disp(['Number of colors: ' num2str(nColFul) ' (including ' num2str(nColStart) ' self defined)']);
if nCol<=nColStart; error('Not enough colors'); end
if nCol>nColFul; warning('More colors than needed'); end
isPreDefCol = false(size(imMapColumn)); % init
for iCol = 1:nColStart
diff = sum(abs(fullMap-repmat(startMap(iCol,:),nColFul,1)),2); % difference between a predefined and all colors
[mDiff,index] = min(diff); % find matching (or most similar) color
if mDiff>0.05 % color handling is not precise
warning(['Predefined color ' num2str(iCol) ' does not appear in image'])
continue
end
isThisPreDefCol = imMapColumn==index; % find all pixel with predefined color
disp([num2str(sum(isThisPreDefCol(:))) ' pixel have predefined color ' num2str(iCol)]);
isPreDefCol = or(isPreDefCol,isThisPreDefCol); % combine with overall list
end
[~,mapAdditional] = rgb2ind(imRGBcolumn(~isPreDefCol,:,:),nCol-nColStart,'nodither'); % create map of remaining colors
map = [startMap;mapAdditional];
|
许可协议
我,本作品著作权人,特此采用以下许可协议发表本作品:
| 本作品采用知识共享CC0 1.0 通用公有领域贡献许可协议授权。 | |
| 采用本宣告发表本作品的人,已在法律允许的范围内,通过在全世界放弃其对本作品拥有的著作权法规定的所有权利(包括所有相关权利),将本作品贡献至公有领域。您可以复制、修改、传播和表演本作品,将其用于商业目的,无需要求授权。
http://creativecommons.org/publicdomain/zero/1.0/deed.enCC0Creative Commons Zero, Public Domain Dedicationfalsefalse |
说明
添加一行文字以描述该文件所表现的内容
此文件中描述的项目
描绘内容
29 7 2017
文件历史
点击某个日期/时间查看对应时刻的文件。
| 日期/时间 | 缩略图 | 大小 | 用户 | 备注 | |
|---|---|---|---|---|---|
| 当前 | 2017年10月1日 (日) 20:35 | 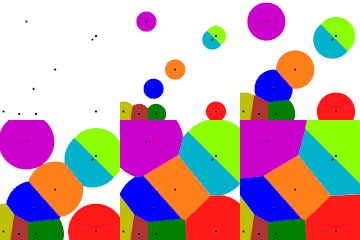 | 500 × 500(1.24 MB) | Jahobr | code update; additional Point |
| 2017年7月29日 (六) 01:32 |  | 500 × 500(1.19 MB) | Jahobr | User created page with UploadWizard |
文件用途
以下页面使用本文件:
全域文件用途
以下其他wiki使用此文件:
- ca.wikipedia.org上的用途
- de.wikipedia.org上的用途
- en.wikipedia.org上的用途
- fi.wikipedia.org上的用途
- sl.wikipedia.org上的用途
- zh-yue.wikipedia.org上的用途
隐藏分类:


