
File:COVID-19 Outbreak World Map per Capita.svg

原始文件 (SVG文件,尺寸为2,921 × 1,500像素,文件大小:2.78 MB)

|
This file may be updated to reflect new information. If you wish to use a specific version of the file without new updates being mirrored, please upload the required version as a separate file. |
摘要
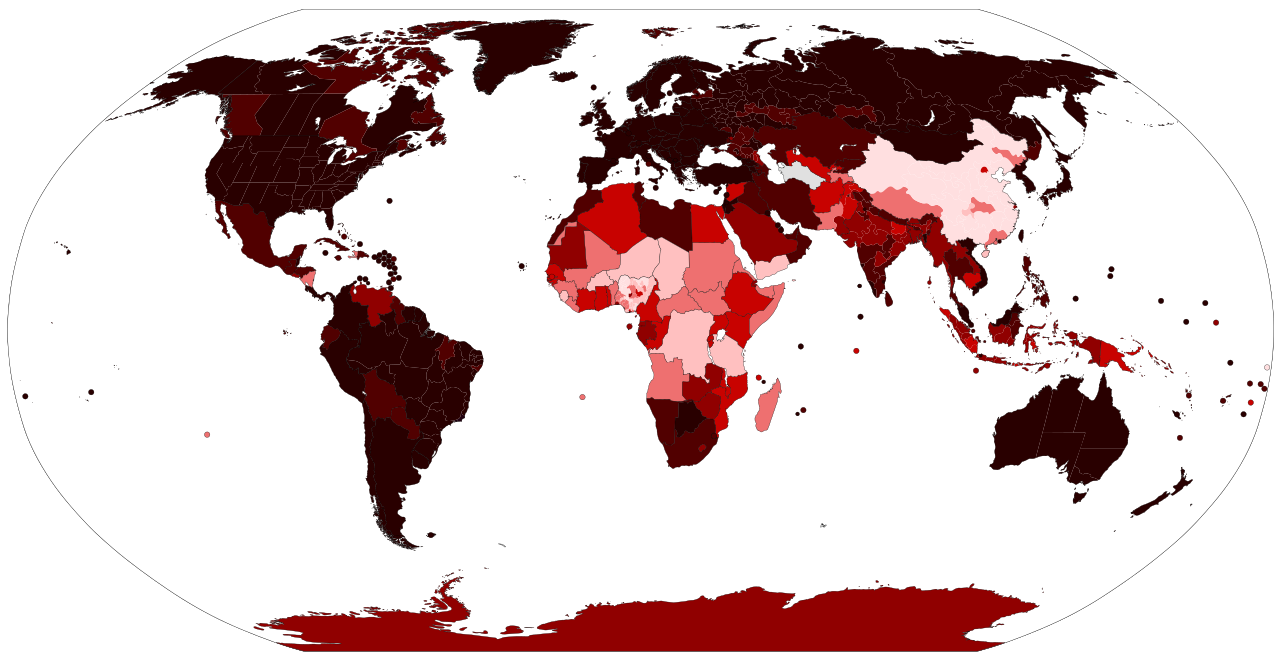
| 描述 |
Deutsch: Häufigkeit der gemeldeten Corona-Infektionen / pro 1000 Einwohner English: Map of the COVID-19 verified number of infected per capita as of . In the latest versions of the map there is a color bar legend. See the file history farther down for the latest upload date from the source. Español: Mapa del número verificado de infectados per cápita por la COVID-19 al . > 100 casos por 1.000 habitantes 30 – 100 casos por 1.000 habitantes 10 – 30 casos por 1.000 habitantes 3 – 10 casos por 1.000 habitantes 1 – 3 casos por 1.000 habitantes 0.3 – 1 casos por 1.000 habitantes > 0 – 0.3 casos por 1.000 habitantes No hay casos notificados, no hay población o no hay datos disponibles Français : Carte du nombre vérifié de cas d’infection à la covid-19 par habitant au . Português: Mapa do número de casos verificados de infectados pela COVID-19 per capita em . Русский: Карта количества подтверждённых случаев заражения COVID-19 на душу населения по состоянию на .y Українська: Карта підтвердженого числа інфікованих COVID-19 на душу населення станом на . 中文: 經驗證的各國感染人均COVID-19病例地圖,資料於更新。 由於情況發展迅速,新病例可能無法立即呈現。 若要取得最新的病例信息,請參閱主要文章2019-20冠狀病毒大流行或世界衛生組織的情況報告。 Legend information for older versions: 為更精準地顯示疾病的蔓延,面积大于300万平方公里或人口大于2亿人的国家均劃分為其一級行政區域。 每千位居民有 > 100 例 每千位居民有 30 – 100 例 每千位居民有 10 – 30 例 每千位居民有 3 – 10 例 每千位居民有 1 – 3 例 每千位居民有 0.3 – 1 例 每千位居民有 > 0 – 0.3 例 无上报的病例、无人居住或无可用数据 |
| 日期 |
2020年3月17日 (First version). Date of first upload to the Wikimedia Commons. An upload link is at the end of the file history list. Please upload new versions at least once per week. Update the "point in time" date in the Wikidata entry linked below. {{wikidata|property|Q95963597|P585}} is used in map captions on Wikipedia. It provides the map date. To enable the date change click the purge link after updating the Wikidata entry. |
| 来源 |
Latest versions: https://ourworldindata.org/explorers/coronavirus-data-explorer?tab=map&Metric=Confirmed+cases&Interval=Cumulative&Relative+to+Population=true&Align+outbreaks=false&country=~OWID_WRL - Our World in Data. Click on the download tab to download map. The table tab has a table of the exact data by country. Source tab says data is from the COVID-19 Data Repository by the Center for Systems Science and Engineering (CSSE) at Johns Hopkins University. The map at the source is interactive and provides more detail. For example, run your cursor over the color bar legend to see the countries that apply to that point in the legend. Older versions: 自己的作品 |
| 作者 | Raphaël Dunant, Gajmar (maintainer),幺于 (maintainer) |
| SVG开发 |
许可协议
文件历史
点击某个日期/时间查看对应时刻的文件。
| 日期/时间 | 缩略图 | 大小 | 用户 | 备注 | |
|---|---|---|---|---|---|
| 当前 | 2022年12月24日 (六) 05:54 | | 2,921 × 1,500(2.78 MB) | AKS471883 | update |
| 2022年12月7日 (三) 03:34 |  | 2,921 × 1,500(2.78 MB) | AKS471883 | update | |
| 2022年11月20日 (日) 07:58 |  | 2,921 × 1,500(2.78 MB) | AKS471883 | update | |
| 2022年8月31日 (三) 07:54 |  | 2,921 × 1,500(2.78 MB) | AKS471883 | update | |
| 2022年8月30日 (二) 07:40 |  | 2,921 × 1,500(2.78 MB) | 幺于 | update | |
| 2022年6月27日 (一) 07:42 |  | 2,921 × 1,500(2.78 MB) | 幺于 | update | |
| 2022年5月22日 (日) 03:36 |  | 2,921 × 1,500(2.78 MB) | 幺于 | update | |
| 2022年5月22日 (日) 02:52 |  | 2,921 × 1,500(2.78 MB) | AKS471883 | Update | |
| 2022年5月21日 (六) 12:38 |  | 2,921 × 1,500(2.78 MB) | AKS471883 | update | |
| 2022年5月19日 (四) 10:51 |  | 2,921 × 1,500(2.78 MB) | AKS471883 | Easter Island to Chile |
文件用途
以下7个页面使用本文件:
全域文件用途
以下其他wiki使用此文件:
- af.wikipedia.org上的用途
- ar.wikipedia.org上的用途
- arz.wikipedia.org上的用途
- ast.wikipedia.org上的用途
- as.wikipedia.org上的用途
- awa.wikipedia.org上的用途
- azb.wikipedia.org上的用途
- az.wikipedia.org上的用途
- bg.wikipedia.org上的用途
- bjn.wikipedia.org上的用途
- bn.wikipedia.org上的用途
- bo.wikipedia.org上的用途
- br.wikipedia.org上的用途
- ca.wikipedia.org上的用途
- cs.wikipedia.org上的用途
- dag.wikipedia.org上的用途
- de.wikipedia.org上的用途
- Benutzer:Mapmaster
- COVID-19-Pandemie
- COVID-19-Pandemie in Italien
- COVID-19-Pandemie in Deutschland
- COVID-19-Pandemie in Südkorea
- COVID-19-Pandemie in der Schweiz
- COVID-19-Pandemie in Österreich
- Vorlage:Navigationsleiste COVID-19-Pandemie
- COVID-19-Pandemie in Frankreich
- COVID-19-Pandemie im Iran
- COVID-19-Pandemie in den Vereinigten Staaten
- COVID-19-Pandemie in der Volksrepublik China
- COVID-19-Pandemie in Spanien
- COVID-19-Pandemie in Osttimor
- COVID-19-Pandemie in Norwegen
- COVID-19-Pandemie in Afrika
- COVID-19-Pandemie in Dänemark
- COVID-19-Pandemie in Japan
- COVID-19-Pandemie in Finnland
- COVID-19-Pandemie in Polen
- COVID-19-Pandemie im Königreich der Niederlande
- COVID-19-Pandemie in Vietnam
- COVID-19-Pandemie in San Marino
- COVID-19-Pandemie im Vereinigten Königreich
- COVID-19-Pandemie in Belgien
- COVID-19-Pandemie in Israel
- COVID-19-Pandemie in Liechtenstein
- COVID-19-Pandemie in Indien
- COVID-19-Pandemie in Kanada
- COVID-19-Pandemie in Brasilien
- COVID-19-Pandemie in Portugal
- Benutzer:Triplec85/COVID-19-Pandemie in
查看本文件的更多全域用途。