跳转到内容

File:Ramseypic.svg

页面内容不支持其他语言。
这个文件来自维基共享资源
维基百科,自由的百科全书

原始文件 (SVG文件,尺寸为400 × 400像素,文件大小:27 KB)


描述
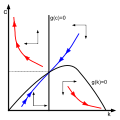
English: Ramsey growth model graph. The blue line represents the dynamic adjustment path of the economy. It is a stable path of the dynamic system. The red lines represent dynamic paths which are ruled out by the transversality condition.
Español: Gráfica del modelo de crecimiento de Ramsey. La línea azul representa la trayectoria del ajuste dinámico de la economía. Es una ruta estable del sistema dinámico. Las líneas rojas representan trayectorias dinámicas que se rigen por la condición de transversalidad.
日期 (UTC)
来源
作者
我,本作品著作权人,特此采用以下许可协议发表本作品:
Public domain 本作品已被作者英语维基百科的[[Wikipedia:User:英语维基百科的[[Wikipedia:User:{{{1}}}|{{{1}}}]]|英语维基百科的[[Wikipedia:User:{{{1}}}|{{{1}}}]]]]释出到公有领域。这适用于全世界。
在一些国家这可能不合法;如果是这样的话,那么:
[[:Wikipedia:en:User:[[:Wikipedia:en:User:{{{1}}}|{{{1}}}]]|[[:Wikipedia:en:User:{{{1}}}|{{{1}}}]]]]无条件地授予任何人以任何目的使用本作品的权利,除非这些条件是法律规定所必需的。
本作品已被作者[[::|中文维基百科]]项目的Example释出到公有领域。这适用于全世界。

如果这样做不合法的话:
Example无条件地授予任何人以任何目的使用本作品的权利,除非这些条件是法律规定所必需的。

您可以选择您需要的许可协议。

原始上传日志

This image is a derivative work of the following images:

  • File:Ramseypic-es.png licensed with PD-user-en, PD-user-w
    • 2011-01-01T19:53:16Z Dalton2 2000x1800 (119465 Bytes) {{Information |Description=Ramsey growth model graph/Gráfica del modelo de crecimiento Ramsey |Source=http://en.wikipedia.org/wiki/File:Ramseypic.JPG |Date=1/1/2011 |Author=Volunteer Marek (original version), Dalton2 (new ve

Uploaded with derivativeFX

说明

添加一行文字以描述该文件所表现的内容

此文件中描述的项目

描绘内容

版权状态 简体中文(已转写)

媒体类型 简体中文(已转写)

image/svg+xml

校验和 简体中文(已转写)

976500485af3ec548ce449cfee4e244f444b6646

断定方法:​SHA-1 简体中文(已转写)

数据大小 简体中文(已转写)

27,855 字节

400 像素

400 像素

文件历史

点击某个日期/时间查看对应时刻的文件。

日期/时间缩⁠略⁠图大小用户备注
当前2011年1月1日 (六) 21:512011年1月1日 (六) 21:51版本的缩略图400 × 400(27 KB)Rondador¿?
2011年1月1日 (六) 21:492011年1月1日 (六) 21:49版本的缩略图400 × 400(27 KB)RondadorFixed transparency.
2011年1月1日 (六) 21:412011年1月1日 (六) 21:41版本的缩略图400 × 400(35 KB)Rondador{{Information |Description={{en|1=Ramsey growth model graph. The blue line represents the dynamic adjustment path of the economy. It is a stable path of the dynamic system. The red lines represent dynamic paths which are ruled out by the transversality co

以下2个页面使用本文件:

全域文件用途

以下其他wiki使用此文件: