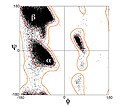
File:Ramachandran plot general 100K.jpg
外观

本预览的尺寸:671 × 599像素。 其他分辨率:269 × 240像素 | 537 × 480像素 | 750 × 670像素。
原始文件 (750 × 670像素,文件大小:225 KB,MIME类型:image/jpeg)
文件历史
点击某个日期/时间查看对应时刻的文件。
| 日期/时间 | 缩略图 | 大小 | 用户 | 备注 | |
|---|---|---|---|---|---|
| 当前 | 2010年1月29日 (五) 14:25 |  | 750 × 670(225 KB) | Dcrjsr | labeled and cropped |
| 2010年1月29日 (五) 05:44 |  | 1,024 × 768(192 KB) | Dcrjsr | {{Information |Description={{en|1=φ,ψ plot ("Ramachandran diagram") of the torsion angles that specify protein backbone conformation. Similar to figures in Lovell et al. 2003<ref>{{cite journal | last = Lovell | first = SC | year = 2003 | title = Stru |
文件用途
以下页面使用本文件:
全域文件用途
以下其他wiki使用此文件:
- bs.wikipedia.org上的用途
- ca.wikipedia.org上的用途
- en.wikipedia.org上的用途
- en.wikibooks.org上的用途
- et.wikipedia.org上的用途
- fr.wikipedia.org上的用途
- gl.wikipedia.org上的用途
- ja.wikipedia.org上的用途
- mk.wikipedia.org上的用途
- ms.wikipedia.org上的用途
- pt.wikipedia.org上的用途
- ru.wikipedia.org上的用途
- sk.wikipedia.org上的用途
- tr.wikipedia.org上的用途
- uk.wikipedia.org上的用途


