
File:South Africa 2001 dominant population group map.svg

此SVG文件的PNG预览的大小:689 × 600像素。 其他分辨率:276 × 240像素 | 552 × 480像素 | 882 × 768像素 | 1,177 × 1,024像素 | 2,353 × 2,048像素 | 1,072 × 933像素。
原始文件 (SVG文件,尺寸为1,072 × 933像素,文件大小:813 KB)
摘要
| 描述 |
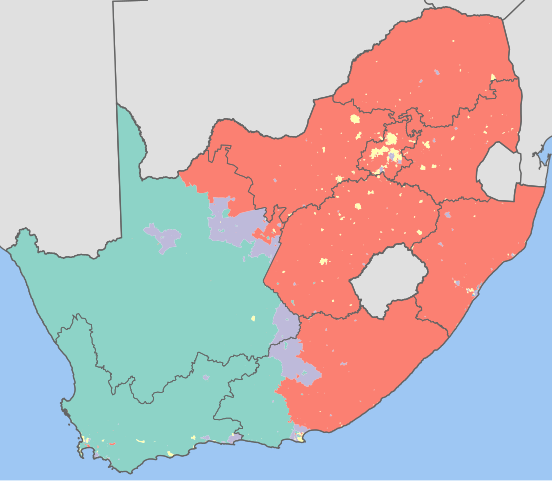
English: Map showing the dominant population groups in South Africa, according to Census 2001 at the "Main Place" level. In this context, a population group is dominant if it makes up more than 50% of the population in an area, or if it makes up more than 33% and no other group makes up more than 25%.
Black African
Coloured
Indian or Asian
White
No group dominant
Projection is Albers Equal-Area Conic, with standard parallels at 25.5° S and 31.5° S, and origin at 28.5° S 25.5° E. |
| 日期 | |
| 来源 | Statistics South Africa's Census 2001 is the source of the basic population data. The map results from my own processing of the data. |
| 作者 | Htonl |
许可协议
The following license applies to the population data on which the map is based:

|
本文件的著作权人,Stats SA,允许任何人在适当地表明著作权人的姓名的前提下,以任何目的使用本文件。传播,演绎作品,商业用途及所有其他用途被允许。 |
署名:
"the user acknowledges Stats SA as the source of the basic data wherever they process, apply, utilise, publish or distribute the data, and also that they specify that the relevant application and analysis (where applicable) result from their own processing of the data" [1]
|
The following tag applies to the map itself:
| 我,本作品著作权人,释出本作品至公有领域。这适用于全世界。 在一些国家这可能不合法;如果是这样的话,那么: 我无条件地授予任何人以任何目的使用本作品的权利,除非这些条件是法律规定所必需的。 |
文件历史
点击某个日期/时间查看对应时刻的文件。
| 日期/时间 | 缩略图 | 大小 | 用户 | 备注 | |
|---|---|---|---|---|---|
| 当前 | 2010年11月29日 (一) 11:26 | | 1,072 × 933(813 KB) | Htonl | remove grey "undefined" areas by drawing from municipal data |
| 2010年10月2日 (六) 13:57 |  | 1,072 × 933(832 KB) | Htonl | tweak | |
| 2010年10月1日 (五) 23:50 |  | 1,072 × 933(710 KB) | Htonl | even smaller filesize | |
| 2010年10月1日 (五) 23:31 |  | 1,072 × 933(799 KB) | Htonl | new approach | |
| 2010年10月1日 (五) 21:51 |  | 1,072 × 933(2.92 MB) | Htonl | Reverted to version as of 17:41, 1 October 2010 | |
| 2010年10月1日 (五) 21:43 |  | 1,072 × 933(2.87 MB) | Htonl | try again | |
| 2010年10月1日 (五) 21:33 |  | 1,072 × 933(2.79 MB) | Htonl | tweak | |
| 2010年10月1日 (五) 17:41 |  | 1,072 × 933(2.92 MB) | Htonl | use equal-area projection | |
| 2010年2月16日 (二) 18:50 |  | 1,000 × 786(2.81 MB) | Htonl | tweak | |
| 2010年2月7日 (日) 00:18 |  | 1,000 × 786(3.04 MB) | Htonl | =={{int:filedesc}}== {{Information |Description={{en|1=Map showing the dominant population groups in South Africa, according to Census 2001 at the "Main Place" level. In this context, a population group is dominant if it makes up more than 50% of the popu |
文件用途
以下页面使用本文件: