跳转到内容

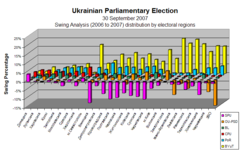
File:Ukrainian parliamentary election, 2007 (SwingByRegion).PNG

页面内容不支持其他语言。
这个文件来自维基共享资源
维基百科,自由的百科全书

Ukrainian_parliamentary_election,_2007_(SwingByRegion).PNG (767 × 477像素,文件大小:16 KB,MIME类型:image/png


摘要

描述
日期
来源 Self-made based off map by Muumi with data from Central Election Commission of Ukraine
作者 User:DemocracyATwork
授权
(二次使用本文件)
w:zh:知识共享
署名 相同方式共享
本文件采用知识共享署名-相同方式共享 1.0 通用许可协议授权。
署名: DemocracyATwork
您可以自由地:
  • 共享 – 复制、发行并传播本作品
  • 修改 – 改编作品
惟须遵守下列条件:
  • 署名 – 您必须对作品进行署名,提供授权条款的链接,并说明是否对原始内容进行了更改。您可以用任何合理的方式来署名,但不得以任何方式表明许可人认可您或您的使用。
  • 相同方式共享 – If you alter, transform, or build upon this work, you must distribute the resulting work under the same license as the original.
其他版本

Collection

Results of the parliamentary elections:
Politcal alignment 2007
Vote percenatge 2006 to 2007 (Top Six parties)
Swing 2006 to 2007 (Top Six parties)

Regional Analysis of the parliamentary elections:

Highest Vote per region
Charts showing the top six parties support - percentage of total national vote and Electoral Region
Vote Percentage by Electoral Region Vote Percentage by Electoral Region Swing by Electoral Regions
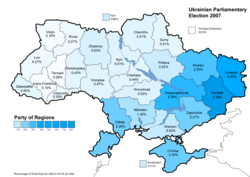
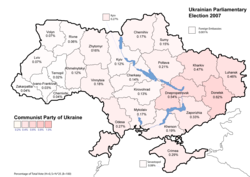
Maps showing the top six parties support - percentage of total national vote
Party of Regions results (34.37%)
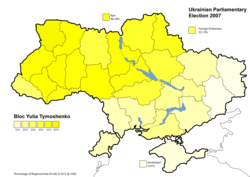
Bloc Yulia Tymoshenko results (30.71%
Our Ukraine People's Self-Defence results (14.15%)
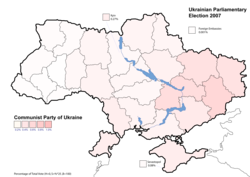
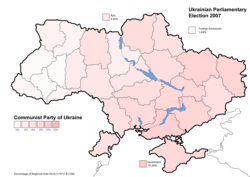
Communist Party of Ukraine results (5.39%)
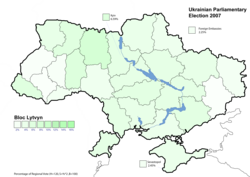
Bloc Lytvyn Party results (3.96%)
Socialist Party of Ukraine results (2.86%)
Maps showing the top six parties support - percentage of total national vote (Minimal text)
Party of Regions results (34.37%)
Bloc Yulia Tymoshenko results (30.71%
Our Ukraine People's Self-Defence results (14.15%)
Communist Party of Ukraine results (5.39%)
Bloc Lytvyn Party results (3.96%)
Socialist Party of Ukraine results (2.86%)
Maps showing the top six parties support - percentage per region
Party of Regions results (34.37%)
Bloc Yulia Tymoshenko results (30.71%
Our Ukraine People's Self-Defence results (14.15%)
Communist Party of Ukraine results (5.39%)
Bloc Lytvyn Party results (3.96%)
Socialist Party of Ukraine results (2.86%)


2007 [1] [2] [3] [4] [5] [6]

2006 [7] [8] [9] [10] [11] [12]

A swing analysis is common in any election. It shows the change in voter percentage for each party by regions from 2006 to 2007.

许可协议

Public domain 我,本作品著作权人,释出本作品至公有领域。这适用于全世界。
在一些国家这可能不合法;如果是这样的话,那么:
我无条件地授予任何人以任何目的使用本作品的权利,除非这些条件是法律规定所必需的。
  1. Template:Cite gov
  2. Template:Cite gov
  3. Template:Cite gov
  4. Template:Cite gov
  5. Template:Cite gov
  6. Template:Cite gov
  7. Template:Cite gov
  8. Template:Cite gov
  9. Template:Cite gov
  10. Template:Cite gov
  11. Template:Cite gov
  12. Template:Cite gov

说明

添加一行文字以描述该文件所表现的内容

此文件中描述的项目

描绘内容

条形统计图 简体中文(已转写)

版权状态 简体中文(已转写)

媒体类型 简体中文(已转写)

image/png

文件历史

点击某个日期/时间查看对应时刻的文件。

日期/时间缩⁠略⁠图大小用户备注
当前2008年2月20日 (三) 17:072008年2月20日 (三) 17:07版本的缩略图767 × 477(16 KB)DemocracyATworkUkrainian Parliamentary Election 2007 Results of election (Political Swing by region) chart. Removed boarder.
2008年2月17日 (日) 23:102008年2月17日 (日) 23:10版本的缩略图748 × 477(16 KB)DemocracyATworkUpdate to reflect color change for Bloc Lytvyn to match with the Parliamentary seat allocation map. From grey to geen.
2008年2月13日 (三) 14:242008年2月13日 (三) 14:24版本的缩略图748 × 477(16 KB)DemocracyATwork== Summary == {{Information |Description='''English:''' Ukrainian parliamentary election, 2007 sorted to better correlate to data table. |Source=Self-made based off [[:Image:Wahlkreise ukraine 2006 eng.png|ma
2008年2月6日 (三) 14:362008年2月6日 (三) 14:36版本的缩略图748 × 477(19 KB)File Upload Bot (Magnus Manske) {{BotMoveToCommons|uk.wikipedia}} {{Information |Description={{uk|uk:?????????:?????????? 2007 http://www.cvk.gov.ua/pls/vnd2007/W6P320?PT001F01=600&pPlace=1 http://www.cvk.gov.ua/pls/vnd2007/W6P320?PT001F01=600&pPlace=2 http://www.c

以下页面使用本文件:

全域文件用途

以下其他wiki使用此文件: