此为根据官方最新人口普查资料而建立的南美洲城市人口列表。该列表仅列出人口数超过600,000人的城市。
|
|
城市
|
图片
|
国家
|
人口
|
年度
|
| 1
|
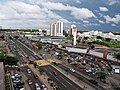
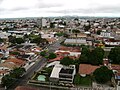
圣保罗
|

|
 巴西 巴西
|
11,967,825[1]
|
2015
|
| 2
|
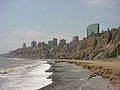
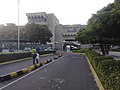
利马
|

|
 秘鲁 秘鲁
|
8,894,412[2]
|
2015
|
| 3
|
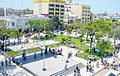
波哥大
|

|
 哥伦比亚 哥伦比亚
|
7,862,277[3]
|
2015
|
| 4
|
里约热内卢
|

|
巴西
|
6,476,631[1]
|
2015
|
| 5
|
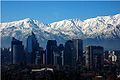
圣地牙哥
|
|
 智利 智利
|
5,507,282[4]
|
2015
|
| 6
|
卡拉卡斯
|

|
 委内瑞拉 委内瑞拉
|
3,289,886[5]
|
2015
|
| 7
|
布宜诺斯艾利斯
|

|
 阿根廷 阿根廷
|
3,054,267[6]
|
2015
|
| 8
|
萨尔瓦多
|

|
巴西
|
2,921,087[1]
|
2015
|
| 9
|
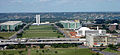
巴西利亚
|
|
巴西
|
2,914,830[1]
|
2015
|
| 10
|
福塔雷萨
|

|
巴西
|
2,591,188[1]
|
2015
|
| 11
|
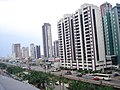
瓜亚基尔
|

|
 厄瓜多尔 厄瓜多尔
|
2,589,229[7]
|
2015
|
| 12
|
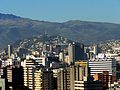
基多
|
|
厄瓜多尔
|
2,551,721[7]
|
2015
|
| 13
|
贝洛奥里藏特
|

|
巴西
|
2,502,557[1]
|
2015
|
| 14
|
麦德林
|

|
哥伦比亚
|
2,434,647[3]
|
2015
|
| 15
|
卡利
|

|
哥伦比亚
|
2,333,203[3]
|
2015
|
| 16
|
玛瑙斯
|

|
巴西
|
2,057,711[1]
|
2015
|
| 17
|
库里蒂巴
|

|
巴西
|
1,879,355[1]
|
2015
|
| 18
|
马拉开波
|

|
委内瑞拉
|
1,653,211[5]
|
2015
|
| 19
|
勒西菲
|

|
巴西
|
1,617,183[1]
|
2015
|
| 20
|
圣克鲁斯
|

|
 玻利维亚 玻利维亚
|
1,614,224[8]
|
2015
|
| 21
|
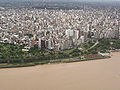
阿雷格里港
|

|
巴西
|
1,476,867[1]
|
2015
|
| 22
|
贝伦
|
|
巴西
|
1,439,561[1]
|
2015
|
| 23
|
戈亚尼亚
|

|
巴西
|
1,430,697[1]
|
2015
|
| 24
|
科尔多瓦
|

|
阿根廷
|
1,414,201[9]
|
2015
|
| 25
|
蒙特维多
|

|
 乌拉圭 乌拉圭
|
1,379,560[10]
|
2015
|
| 26
|
瓜鲁柳斯
|

|
巴西
|
1,324,781[1]
|
2015
|
| 27
|
巴兰基亚
|

|
哥伦比亚
|
1,214,253[3]
|
2015
|
| 28
|
坎皮纳斯
|

|
巴西
|
1,164,098[1]
|
2015
|
| 29
|
巴基西梅托
|

|
委内瑞拉
|
1,116,182[5]
|
2015
|
| 30
|
圣路易斯
|
|
巴西
|
1,073,893[1]
|
2015
|
| 31
|
圣贡萨洛
|

|
巴西
|
1,038,081[1]
|
2015
|
| 32
|
马塞约
|

|
巴西
|
1,013,773[1]
|
2015
|
| 33
|
卡亚俄
|
|
秘鲁
|
1,010,315[2]
|
2015
|
| 34
|
罗萨里奥
|
|
阿根廷
|
985,624[11]
|
2015
|
| 35
|
卡塔赫纳
|

|
哥伦比亚
|
959,594[3]
|
2015
|
| 36
|
瓦伦西亚
|
|
委内瑞拉
|
901,900[5]
|
2015
|
| 37
|
埃尔阿尔托
|

|
玻利维亚
|
891,434[8]
|
2015
|
| 38
|
卡希亚斯公爵城
|
|
巴西
|
882,729[1]
|
2015
|
| 39
|
圭亚那城
|

|
委内瑞拉
|
877,547[5]
|
2015
|
| 40
|
纳塔尔
|

|
巴西
|
869,954[1]
|
2015
|
| 41
|
阿雷基帕
|
|
秘鲁
|
869,351[12]
|
2015
|
| 42
|
格兰德营
|

|
巴西
|
853,622[1]
|
2015
|
| 43
|
特雷西纳
|
|
巴西
|
844,245[1]
|
2015
|
| 44
|
圣贝尔纳多-杜坎普
|

|
巴西
|
816,925[1]
|
2015
|
| 45
|
新伊瓜苏
|
|
巴西
|
807,492[1]
|
2015
|
| 46
|
特鲁希略
|

|
秘鲁
|
799,550[12]
|
2015
|
| 47
|
若昂佩索阿
|

|
巴西
|
791,438[1]
|
2015
|
| 48
|
拉巴斯
|

|
玻利维亚
|
789,541[8]
|
2015
|
| 49
|
圣安德烈
|

|
巴西
|
710,210[1]
|
2015
|
| 50
|
奥萨斯库
|

|
巴西
|
694,844[1]
|
2015
|
| 51
|
圣若泽-杜斯坎普斯
|

|
巴西
|
688,597[1]
|
2015
|
| 52
|
拉普拉塔
|
|
阿根廷
|
687,378[13]
|
2015
|
| 53
|
热博阿陶
|

|
巴西
|
686,122[1]
|
2015
|
| 54
|
科恰班巴
|

|
玻利维亚
|
672,255[8]
|
2015
|
| 55
|
里贝朗普雷图
|

|
巴西
|
666,323[1]
|
2015
|
| 56
|
乌贝兰迪亚
|

|
巴西
|
662,362[1]
|
2015
|
| 57
|
孔塔任
|

|
巴西
|
648,766[1]
|
2015
|
| 58
|
索罗卡巴
|
|
巴西
|
644,919[1]
|
2015
|
| 59
|
马德普拉塔
|
|
阿根廷
|
640,855[13]
|
2015
|
| 60
|
阿拉卡茹
|

|
巴西
|
632,744[1]
|
2015
|
| 61
|
库库塔
|
|
哥伦比亚
|
628,107[3]
|
2015
|
| 62
|
费拉迪圣安娜
|
|
巴西
|
617,528[1]
|
2015
|
| 63
|
索莱达
|
|
哥伦比亚
|
614,900[3]
|
2015
|
| 64
|
上普恩特
|

|
智利
|
610,118[4]
|
2015
|
| 65
|
奇克拉约
|
|
秘鲁
|
600,440[12]
|
2015
|
相关连结[编辑]
- ^ 1.00 1.01 1.02 1.03 1.04 1.05 1.06 1.07 1.08 1.09 1.10 1.11 1.12 1.13 1.14 1.15 1.16 1.17 1.18 1.19 1.20 1.21 1.22 1.23 1.24 1.25 1.26 1.27 1.28 1.29 1.30 1.31 1.32 1.33 ESTIMATIVAS DA POPULAÇÃO RESIDENTE NOS MUNICÍPIOS BRASILEIROS COM DATA DE REFERÊNCIA EM 1º DE JULHO DE 2015 (PDF). IBGE. 2016-02-11 [2016-04-23].
- ^ 2.0 2.1 Cuadro Nº 11. Perú: Población total al 30 de junio, por grupos quinquenales de edad, según departamento y provincia, 2015. Perú: Estimaciones y Proyecciones de Población total y edades quinquenales, según Departamento, Provincia y Distrito, 2005-2015. INEI. November 2010 [2016-04-23]. (原始内容存档于2018-12-25).
- ^ 3.0 3.1 3.2 3.3 3.4 3.5 3.6 ESTIMACIONES DE POBLACIÓN 1985 - 2005 Y PROYECCIONES DE POBLACIÓN 2005 - 2020 TOTAL MUNICIPAL POR ÁREA. DANE. 2011-05-12 [2016-04-23]. (原始内容存档于2015-02-21).
- ^ 4.0 4.1 Comunas: Actualización Población 2002-2012 y Proyecciones 2013-2020. Instituto Nacional de Estadísticas. [2016-04-23]. (原始内容存档于2018-12-25).
- ^ 5.0 5.1 5.2 5.3 5.4 Proyección de la población al 30 de junio con base al censo 2011, según entidad federal y municipios, 2000-2050. Instituto Nacional de Estadística. [2016-04-23]. (原始内容存档于2018-12-25).
- ^ Población estimada al 1 de julio de cada año calendario por sexo, según comuna. Ciudad Autónoma de Buenos Aires. Años 2010-2025. 阿根廷国家统计与人口普查研究所. [2016-04-23]. (原始内容存档于2015-06-12).
- ^ 7.0 7.1 Proyección de la Población Ecuatoriana, por años calenario, según cantones 2010-2020. Instituto Nacional de Estadística y Censos. [2016-04-23]. (原始内容存档于2018-10-04).
- ^ 8.0 8.1 8.2 8.3 CUADRO Nº 3. BOLIVIA: PROYECCIONES DE POBLACIÓN, SEGÚN DEPARTAMENTO Y MUNICIPIO, 2012-2020. PROYECCIONES DE POBLACIÓN E INDICADORES DEMOGRÁFICOS, POR AÑOS CALENDARIO, 2012-2020. INE. 2014 [2016-04-25]. (原始内容存档于2016-11-21).
- ^ Población estimada al 1 de julio de cada año calendario por sexo, según departamento. Provincia de Córdoba. Años 2010-2025. 阿根廷国家统计与人口普查研究所. [2016-04-23]. (原始内容存档于2015-09-24).
- ^ Poblaciones Estimadas y Proyectadas por Sexo y Edad según Departamentos: Período 1996-2025.. Instituto Nacional de Estadística. [2016-04-23]. (原始内容存档于2018-06-04).
- ^ Indicadores demográficos. Municipalidad de Rosario. [2016-04-23]. (原始内容存档于2018-12-25).
- ^ 12.0 12.1 12.2 Perú: Estimaciones y proyecciones de población total por sexo de las principales ciudades, 2012-2015. Perú: Estimaciones y Proyecciones de Población Total por Sexo, según Principales Ciudades, 2000-2015. INEI. March 2012 [2016-04-23]. [永久失效链接]
- ^ 13.0 13.1 Población estimada al 1 de julio de cada año calendario por sexo, según partido. Provincia de Buenos Aires. Años 2010-2025. 阿根廷国家统计与人口普查研究所. [2016-04-23]. (原始内容存档于2015-09-24).


.jpg)


.jpg)


_-_Recife_-_Pernambuco_-_Brasil.jpg)


.JPG)


.jpg)


.jpg)

